53BP1 and the LINC Complex Promote Microtubule-Dependent DSB Mobility and DNA Repair - PubMed (original) (raw)
53BP1 and the LINC Complex Promote Microtubule-Dependent DSB Mobility and DNA Repair
Francisca Lottersberger et al. Cell. 2015.
Abstract
Increased mobility of chromatin surrounding double-strand breaks (DSBs) has been noted in yeast and mammalian cells but the underlying mechanism and its contribution to DSB repair remain unclear. Here, we use a telomere-based system to track DNA damage foci with high resolution in living cells. We find that the greater mobility of damaged chromatin requires 53BP1, SUN1/2 in the linker of the nucleoskeleton, and cytoskeleton (LINC) complex and dynamic microtubules. The data further demonstrate that the excursions promote non-homologous end joining of dysfunctional telomeres and implicated Nesprin-4 and kinesins in telomere fusion. 53BP1/LINC/microtubule-dependent mobility is also evident at irradiation-induced DSBs and contributes to the mis-rejoining of drug-induced DSBs in BRCA1-deficient cells showing that DSB mobility can be detrimental in cells with numerous DSBs. In contrast, under physiological conditions where cells have only one or a few lesions, DSB mobility is proposed to prevent errors in DNA repair.
Copyright © 2015 Elsevier Inc. All rights reserved.
Figures
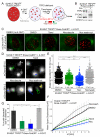
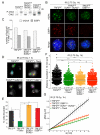
Figure 1. Microtubule dynamics promote mobility of dysfunctional telomeres
(A) Schematic of the imaging approach. mCherry-BP1-2 foci at deprotected telomeres after TRF2 deletion were traced for 10 min by time-lapse microscopy. (B) Immunoblot for TRF2 and phosphorylation of Chk2 in TRF2F/F RsCre-ERT1 MEFs at 55-62 h after addition of 4-OH tamoxifen (4-OHT). (C) Images of mCherry-53BP1-2 foci with microtubule visualized with YFP-αTubulin (with γ-correction). (D) Examples of traces of mCherry-53BP1-2 foci as described in (B) and (C) and shown in Movies S1A-D. (E) and (F) Distribution of the cumulative distance travelled and MSD with SDs of all the mCherry-BP1-2 foci detected in the conditions as (C). Data obtained from three independent experiments with >10 cells/condition. Numbers below the data points are averages and SDs of the three median values from three independent experiments. Bars represent the median of all the foci (>1000) traced. P values are from two-tailed Mann-Whitney test. Symbols: (****) p<0.0001, (***) p<0.001, (**) p<0.01, (*) p<0.05, (ns) not significant. (G) Percentage of cells discarded (means and SDs from three independent experiments). P values were based on unpaired t-test. Symbols as in (F). See also Figure S1 and Table S1.
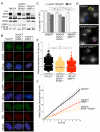
Figure 2. SUN1 and SUN2 promote mobility of dysfunctional telomeres
(A) Immunoblots for TRF2, SUN1, SUN2, 53BP1, and phosphorylated Chk2 in the indicated MEFs at 72 h after Hit&Run Cre. (B) TIF (Telomere dysfunction Induced Foci) assay on the MEFs described in (A). Telomeres were detected by FISH with FITC-(CCCTAA)3 probe (green). Phosphorylated H2AX (top panel), 53BP1 (middle panel), and Rif1 (bottom panel) were detected by IF (red). DAPI: DNA (blue). (C) Quantification of TIF response after Cre as assayed in (B). Cells with >10 TIFs were scored. Values are means and SDs of three independent experiments. P values were from an unpaired t-test (see legend to Figure 1). (D) Examples of traces of mCherry-53BP1-2 foci at 66-72 h after Cre (see Movies S3A-C). (E) and (F) Distribution of the cumulative distance travelled and MSDs with SDs of mCherry-BP1-2 foci in the analyzed MEFs (as (D)) in four experiments, as described in Figure 1. See also Figure S2 and Table S1.
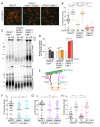
Figure 3. The LINC complex promotes NHEJ of dysfunctional telomeres
(A) Metaphases showing telomere fusions in the indicated MEFs at 84 h after Hit&Run Cre. Telomeres were detected by FISH with a FITC-(CCCTAA)3 probe (green). DNA: DAPI (red). (B) Distribution of telomere fusions as in (A) at 84 and 108 h after Cre. Dots represent % fusions in individual metaphases. Bars represent the median of telomere fusions in 15 metaphases for three independent experiments (45 metaphases). P values from unpaired t-test (see legend to Figure 1). (C) In-gel assay for single-stranded telomeric DNA. Telomeric overhangs detected in situ with end-labeled 32P-(AACCCT)4 in MboI-digested genomic DNA from the indicated MEFs at 84 and 108 h after TRF2 deletion (top panel). Bottom: the DNA was denatured in situ and rehybridized with the same probe to determine the total telomere DNA. (D) Quantification of relative overhang signal as detected in (C). Values represent means for four independent experiments with SDs. The ss telomeric signal was normalized to the total telomeric DNA in the same lane. For each MEF line, the normalized no Cre value of cells was set at 100 and the post-Cre values are given relative to this value. 2way ANOVA for multiple comparisons were used to perform statistical analysis. For p value symbols see legend to Figure 1. (E) Schematic of the LINC complex and microtubules. (F) and (G) Quantification of telomere fusions in TRF2F/F MEFs treated with shRNAs to Nesprin-4 or Kif5B 96 h after Cre and analyzed as in (A) and (B). Bars represent the median % of telomeres fused in three independent experiments (20 metaphases each). (H) Quantification of telomere fusions in TRF2F/F RsCre-ERT1 and TRF2F/F Kif3AF/F RsCre-ERT1 MEFs 72 and 90 h after 4-OHT, as in (A) and (B). See also Figure S2 and Figure S3.
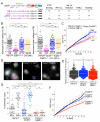
Figure 4. The mobility domain of 53BP1, but not PTIP, is required for mobility of dysfunctional telomeres
(A) Schematic of 53BP1, S/TQ site mutations, and their phenotypes. (B) Quantification of telomere fusions in the indicated MEFs complemented with the indicated 53BP1 alleles 96 h after TRF2 deletion with Hit&Run Cre (as in Figure 3). Data from >70 metaphases analyzed in four independent experiments. For each experiment, the median fusion frequency for 53BP1DB was set to 100 and all other values were normalized to this frequency. (C) MSDs with SDs of mCherry-BP1-2 foci detected in the TRF2-deleted 53BP1−/− MEFs expressing the indicated 53BP1 alleles. Data from three independent experiments. (D) Examples of traces of mCherry-53BP1-2 foci at 66-72 h after Cre in the indicated MEFs (see Movies S4A-C). (E) and (F) Distribution of the cumulative distance travelled and MSDs with SEMs of mCherry-BP1-2 foci in the indicated MEFs (as in Figure 1). Bars represent medians of the cumulative distance travelled >500 foci in the two experiments and numbers indicate the averages and SEMs of the two median values obtained in the two independent experiments. (G) Quantification of telomere fusions in the indicated MEFs at 84 and 108 h after Cre (as in Figure 3). See also Figure S4, Figure S5 and Table S1.
Figure 5. 53BP/LINC/microtubule promoted mobility of IR-induced DSBs
(A) Immunoblot for phosphorylation of Chk2 (as in Figure 2A) in the indicated MEFs at 1 h after 2.75 Gy IR. (B) IF for γH2AX (green) and 53BP1 (red) for cells treated as in (A). DAPI: DNA (blue). (C) Quantification of IR-induced γ-H2AX and 53BP1 foci as assayed in (B). (D) Examples of 10 min traces of mCherry-53BP1-2 foci at 1 h after IR of the cells described in (A) with or without 20 μM Taxol (see Movies S5A-D). (E-G) Percentage of cells discarded, distribution of the cumulative distance travelled, and MSDs with SDs of mCherry-BP1-2 foci detected as (D) and (E) (as in Figure 1). Data from three independent experiments. See related Figure S6 and Table S1.
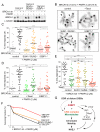
Figure 6. SUN1/2 and dynamic microtubules promote radial formation
(A) Immunoblots for BRCA1 and γ-tubulin in the indicated MEFs (as in Figure 2A) at 144 h after infection with BRCA1 shRNA or empty vector. Olaparib was added 16 h before analysis. (B) Representative mis-rejoined chromosomes (arrowheads). DNA stained with DAPI. (C) Quantification of mis-rejoined chromosomes in the indicated MEFs (as in (A)), analyzed as in (B). Each dot represents a metaphase. Bars represent the median of mis-rejoined chromosomes in three independent experiments (10 metaphases each). P values as in Figure 3B. (D) Quantification of mis-rejoined chromosomes in the indicated MEFs 18 h with or without Taxol as in (C). (E) Quantification of mis-rejoined chromosomes in each metaphase in the indicated MEFs with or without Taxol as described in (C) and (D). All cells used in (A-F) are TRF2F/F. (F) Quantification of colony formation in the indicated cells infected with BRCA1 shRNA and treated with or without Taxol for 7 days. The curves represent the average and SEMs of two independent experiments. (G) Schematic of the role of 53BP1 in NHEJ of distant DSBs. In addition to controlling of DNA end processing, 53BP1 can affect NHEJ by increasing the mobility of DSBs. The mobility of DSBs is dependent on the LINC complex and microtubule dynamics. Dashed arrows indicate the possibility that the DDR affects the LINC complex and microtubules independent of 53BP1. See related Figure S7.
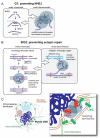
Figure 7. Proposed function and mechanism of 53BP1-dependent mobility of DSBs
(A) and (B) Proposed function for 53BP1-dependent mobility in promoting correct DSB repair. (A) G1: Mobility of DNA ends that have lost their association could promote their rejoining, thereby promoting NHEJ. (B) S/G2: If a DNA end loses connection with the sister chromatid and invades an ectopic locus, DSB mobility could disrupt this aberrant interaction and promote correct HDR. If the DSB is being repaired correctly using HDR on the sister chromatid, mobility will not dissociate the ends because of the presence of cohesin and basepairing. (C) Proposed models for the mechanism of 53BP1/LINC/microtubule dependent mobility of DSBs. The enlarged part of the nucleus shows 53BP1 (red) at a DSB with the ends separated. One end (top) portrays a model in which 53BP1 has a physical connection with the LINC complex (green). The LINC complex connects to dynamic microtubules and thereby moves the LINC-bound 53BP1-covered DNA end. The other end (bottom) portrays a model in which there is no physical connection between the LINC complex and 53BP1. The LINC complex associates with microtubules that ‘poke’ the nucleus. The 53BP1 associated chromatin moves more readily even when not at the periphery, perhaps because 53BP1 alters the flexibility of the chromatin fiber. See text for discussion.
Similar articles
- 53BP1 promotes non-homologous end joining of telomeres by increasing chromatin mobility.
Dimitrova N, Chen YC, Spector DL, de Lange T. Dimitrova N, et al. Nature. 2008 Nov 27;456(7221):524-8. doi: 10.1038/nature07433. Epub 2008 Oct 19. Nature. 2008. PMID: 18931659 Free PMC article. - 53BP1 regulates DSB repair using Rif1 to control 5' end resection.
Zimmermann M, Lottersberger F, Buonomo SB, Sfeir A, de Lange T. Zimmermann M, et al. Science. 2013 Feb 8;339(6120):700-4. doi: 10.1126/science.1231573. Epub 2013 Jan 10. Science. 2013. PMID: 23306437 Free PMC article. - RIF1 is essential for 53BP1-dependent nonhomologous end joining and suppression of DNA double-strand break resection.
Chapman JR, Barral P, Vannier JB, Borel V, Steger M, Tomas-Loba A, Sartori AA, Adams IR, Batista FD, Boulton SJ. Chapman JR, et al. Mol Cell. 2013 Mar 7;49(5):858-71. doi: 10.1016/j.molcel.2013.01.002. Epub 2013 Jan 17. Mol Cell. 2013. PMID: 23333305 Free PMC article. - Double-strand break repair: 53BP1 comes into focus.
Panier S, Boulton SJ. Panier S, et al. Nat Rev Mol Cell Biol. 2014 Jan;15(1):7-18. doi: 10.1038/nrm3719. Epub 2013 Dec 11. Nat Rev Mol Cell Biol. 2014. PMID: 24326623 Review. - 53BP1: pro choice in DNA repair.
Zimmermann M, de Lange T. Zimmermann M, et al. Trends Cell Biol. 2014 Feb;24(2):108-17. doi: 10.1016/j.tcb.2013.09.003. Epub 2013 Oct 4. Trends Cell Biol. 2014. PMID: 24094932 Free PMC article. Review.
Cited by
- Finding a place in the SUN: telomere maintenance in a diverse nuclear landscape.
Ebrahimi H, Cooper JP. Ebrahimi H, et al. Curr Opin Cell Biol. 2016 Jun;40:145-152. doi: 10.1016/j.ceb.2016.03.011. Epub 2016 Apr 8. Curr Opin Cell Biol. 2016. PMID: 27064212 Free PMC article. Review. - DeAnnIso: a tool for online detection and annotation of isomiRs from small RNA sequencing data.
Zhang Y, Zang Q, Zhang H, Ban R, Yang Y, Iqbal F, Li A, Shi Q. Zhang Y, et al. Nucleic Acids Res. 2016 Jul 8;44(W1):W166-75. doi: 10.1093/nar/gkw427. Epub 2016 May 13. Nucleic Acids Res. 2016. PMID: 27179030 Free PMC article. - The Spectrinome: The Interactome of a Scaffold Protein Creating Nuclear and Cytoplasmic Connectivity and Function.
Goodman SR, Johnson D, Youngentob SL, Kakhniashvili D. Goodman SR, et al. Exp Biol Med (Maywood). 2019 Nov;244(15):1273-1302. doi: 10.1177/1535370219867269. Epub 2019 Sep 4. Exp Biol Med (Maywood). 2019. PMID: 31483159 Free PMC article. Review. - Effects of the microtubule nucleator Mto1 on chromosomal movement, DNA repair, and sister chromatid cohesion in fission yeast.
Zhurinsky J, Salas-Pino S, Iglesias-Romero AB, Torres-Mendez A, Knapp B, Flor-Parra I, Wang J, Bao K, Jia S, Chang F, Daga RR. Zhurinsky J, et al. Mol Biol Cell. 2019 Oct 1;30(21):2695-2708. doi: 10.1091/mbc.E19-05-0301. Epub 2019 Sep 4. Mol Biol Cell. 2019. PMID: 31483748 Free PMC article. - DNA repair, recombination, and damage signaling.
Gartner A, Engebrecht J. Gartner A, et al. Genetics. 2022 Feb 4;220(2):iyab178. doi: 10.1093/genetics/iyab178. Genetics. 2022. PMID: 35137093 Free PMC article. Review.
References
- Agmon N, Liefshitz B, Zimmer C, Fabre E, Kupiec M. Effect of nuclear architecture on the efficiency of double-strand break repair. Nat Cell Biol. 2013;15:694–699. - PubMed
- Aten JA, Stap J, Krawczyk PM, van Oven CH, Hoebe RA, Essers J, Kanaar R. Dynamics of DNA double-strand breaks revealed by clustering of damaged chromosome domains. Science. 2004;303:92–95. - PubMed
- Banerjee S, Kaye SB, Ashworth A. Making the best of PARP inhibitors in ovarian cancer. Nat Rev Clin Oncol. 2010;7:508–519. - PubMed
Publication types
MeSH terms
Substances
LinkOut - more resources
Full Text Sources
Other Literature Sources
Research Materials
Miscellaneous
