The position of lysosomes within the cell determines their luminal pH - PubMed (original) (raw)
The position of lysosomes within the cell determines their luminal pH
Danielle E Johnson et al. J Cell Biol. 2016.
Abstract
We examined the luminal pH of individual lysosomes using quantitative ratiometric fluorescence microscopy and report an unappreciated heterogeneity: peripheral lysosomes are less acidic than juxtanuclear ones despite their comparable buffering capacity. An increased passive (leak) permeability to protons, together with reduced vacuolar H(+)-adenosine triphosphatase (V-ATPase) activity, accounts for the reduced acidifying ability of peripheral lysosomes. The altered composition of peripheral lysosomes is due, at least in part, to more limited access to material exported by the biosynthetic pathway. The balance between Rab7 and Arl8b determines the subcellular localization of lysosomes; more peripheral lysosomes have reduced Rab7 density. This in turn results in decreased recruitment of Rab-interacting lysosomal protein (RILP), an effector that regulates the recruitment and stability of the V1G1 component of the lysosomal V-ATPase. Deliberate margination of lysosomes is associated with reduced acidification and impaired proteolytic activity. The heterogeneity in lysosomal pH may be an indication of a broader functional versatility.
© 2016 Johnson et al.
Figures
Figure 1.
Lysosomal pH is heterogeneous. (a) The lysosomes of HeLa cells were loaded with two fluorescently tagged dextrans: the pH-sensitive Oregon green 488–dextran and the pH-insensitive tetramethylrhodamine-dextran. Individual lysosomal pH was measured by ratiometric fluorescence microscopy, and fluorescence values were converted to pH as described in the Conversion of fluorescence ratio to pH section in Materials and methods. The fraction of total lysosomes as a function of pH was plotted (n = 105 individual lysosomes from three independent experiments). (b) The lysosomes of HeLa cells were loaded with Alexa Fluor 647–dextran (magenta) and then loaded with the acidotropic dye LysoTracker (green) and imaged by confocal microscopy. The cell of interest is outlined with a dashed line. White boxes delineate two regions, labeled 1 and 2, which were used to superimpose the two channels in the right-hand insets. Here and elsewhere, white indicates overlap of the signals. (c) Cells expressing soluble EGFP were loaded with Alexa Fluor 647–dextran and LysoTracker. The outline of the cells was defined from the pattern of EGFP fluorescence (not depicted) using Volocity software and was degraded inward by 4.2 µm every cycle (three times) to create four concentric shells (dashed lines), which were used for the calculations shown in d. (d) The fraction of overlapping features (dextran-positive lysosomes containing LysoTracker) for each shell was determined and plotted as a function of distance from the edge of the cell. Error bars represent SEM (n = 10 cells from three independent experiments). Bars, 10 µm.
Figure 2.
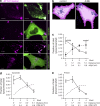
Peripheral lysosome phenotype is magnified by expression of proteins that cause lysosomal redistribution. (a) The lysosomes of HeLa cells were loaded with Alexa Fluor 647–dextran (magenta) and transfected with Arl8b-mCherry, dynamitin-EGFP, FYCO1-mCherry, or cytosolic EGFP cDNAs (all shown in green). (b) Using Volocity software, the boundary of control or Arl8b-expressing cells was determined as in Fig. 1 and was degraded inward by 1.7 µm every cycle (four times) to create four shells (illustrated by shades of pink). Lysosomes are shown in purple. (c) The fraction of total lysosomes per shell in control cells and Arl8b-expressing cells was determined and plotted as a function of distance from the edge of the cell. n = 4 cells from four independent experiments. (d and e) Using a similar analysis, the fraction of total lysosomes per shell in dynamitin-expressing cells (d) and FYCO1-expressing cells (e) was determined and plotted as a function of distance from the edge of the cell. n = 6–16 cells from at least three independent experiments. The dashed lines indicate the fraction of control lysosomes, reproduced from c for comparison. Error bars represent SEM. Bars, 10 µm.
Figure 3.
Lysosomes displaced to the cell periphery by expression of Arl8b are more alkaline. The lysosomes of HeLa cells were loaded with fluorescein-dextran, a ratiometric pH-sensitive dye. Cells were then either mock transfected or transfected with Arl8b-mCherry cDNA. Lysosomal pH was measured by ratiometric fluorescence microscopy as described in the Ratiometric fluorescence microscopy section in Materials and methods. (a) Representative images of control and Arl8b-expressing cells with fluorescein fluorescence ratios converted to pH (see calibration bar). Cells of interest are outlined with dashed lines. Bars, 10 µm. (b) Lysosomal pH was determined in control and Arl8b-expressing cells. Error bars represent SEM (n = 30 and 39 cells from at least nine independent experiments for control and Arl8b transfectants, respectively).
Figure 4.
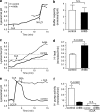
Buffering capacity is indistinguishable in central and peripheral lysosomes, whereas peripheral lysosomes have greater H+ leak and lower H+ pump activity. The lysosomes of HeLa cells were loaded with fluorescein-dextran. Cells were then mock transfected or transfected with Arl8b-mCherry cDNA. Lysosomal pH was measured by ratiometric fluorescence microscopy. (a) Lysosomal buffering capacity was assessed using the NH4Cl pulse technique, as described in the Buffer capacity section in Materials and methods. Control lysosomes were treated with 2 µM of the V-ATPase inhibitor CcA when indicated by the arrow. 3.75 mM NH4Cl was added to both samples where indicated by the arrow. (b) Quantification of lysosomal buffer capacity in control and Arl8b-expressing cells. n = 6–9 cells for each condition from at least six independent experiments. (c) Lysosomal H+ leak was assessed by measuring the rate of alkalinization in control and Arl8b-expressing cells after addition of 2 µM CcA (indicated by arrow). H+ leak was calculated in the pH 6.2–6.9 interval (indicated by dotted lines). (d) Quantification of H+ leak in control and Arl8b-expressing cells. n = 21–27 cells for each condition from at least six independent experiments. (e and f) Lysosomal H+ pump activity was measured in control and Arl8b-expressing cells in the presence or absence of 2 µM CcA as indicated. (e) 30 µM protonophore CCCP was added to untransfected cells either alone or together with CcA, where indicated by the arrow, to dissipate the transmembrane ΔpH. CCCP was removed by addition of 5 mg/ml of defatted BSA when indicated. (f) Quantification of H+ pump activity determined from the rate of reacidification recorded upon removal of CCCP. n = 6–9 cells for each condition from at least three independent experiments. Error bars represent SEM.
Figure 5.
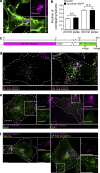
Peripheral lysosomes do not exhibit enhanced interaction with the plasma membrane, nor do they colocalize with early or recycling endocytic markers. (a) The lysosomes of HeLa cells were loaded with Alexa Fluor 647–dextran (magenta) and transfected with dynamitin-EGFP cDNA (not depicted). The plasma membrane was stained with the fluorescent marker PE-rhodamine (green), and the cells were imaged by confocal microscopy in the 5–10-min interval after membrane labeling. The white box indicates the region magnified in the right-hand insets. (b) The fraction of overlapping features (Alexa Fluor 647–dextran-positive lysosomes containing Alexa Fluor 546–dextran) at 20 and 60 min was determined in lysosomes of both control (EGFP transfected) and dynamitin-EGFP–transfected cells. Error bars represent SEM (n = 6 cells for each condition from three independent experiments). (c) Diagrammatic presentation of the protocol used: lysosomes were loaded with Alexa Fluor 647–dextran for 3 h, chased for 12 h, and then loaded with Alexa Fluor 546–dextran for 20 or 60 min. Cells were imaged by confocal microscopy when indicated by the arrows. (d) Representative images of control cells imaged 20 min (left) or 60 min (right) after addition of Alexa Fluor 546–dextran. Cells of interest are outlined with dashed lines. (e) Lysosomes were loaded with Alexa Fluor 647–dextran (magenta) and transfected with Rab5-EGFP (green) or EEA1-EGFP (green). Cells were imaged by confocal microscopy. White boxes indicate the regions magnified in the right-hand insets. (f) Lysosomes were loaded with Alexa Fluor 647–dextran (magenta) and transfected with Rab11a (green) or loaded for 20 min with Alexa Fluor 546–transferrin (green). Cells were imaged by confocal microscopy. White boxes indicate the regions magnified in the right-hand insets. Bars, 10 µm.
Figure 6.
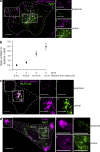
Peripheral lysosomes have decreased levels of Rab7 and RILP-C33. (a) Lysosomes of HeLa cells were loaded with Alexa Fluor 647–dextran (magenta) and transfected with EGFP-Rab7 (green). Cells were imaged by confocal microscopy. (b) The boundary of cells was determined and degraded inward by 4.2 µm every cycle to create four concentric shells as in Fig. 1. The ratio of Rab7 to dextran fluorescence intensity per shell was determined and plotted as a function of distance from the edge of the cell. Error bars represent SEM (n = 13 cells). (c) Lysosomes were loaded with Alexa Fluor 647–dextran (magenta) and transfected with EGFP-RILP-C33 (green). Cells were imaged by confocal microscopy. (d) HeLa cells were transfected with Arl8b-mCherry (magenta) and EGFP-Rab7 (green) and imaged by confocal microscopy. (a, c, and d) The numbered white boxes indicate the regions magnified in the right-hand insets. Bars, 10 µm.
Figure 7.
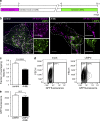
Delayed delivery of newly synthesized components from Golgi to peripheral lysosomes. (a) Diagrammatic presentation of the protocol used: lysosomes were loaded with Alexa Fluor 647–dextran for 3 h and then mock transfected or transfected with Arl8b-mCherry. 12 h later, cells were transfected with the lysosomal membrane protein LIMP2-GFP and imaged by confocal microscopy 6 h later. (b) Representative images of control and Arl8b-expressing cells treated as in panel a. Cells of interest are outlined with dashed lines. The white boxes indicate the regions magnified in the right-hand insets. Bars, 10 µm. (c) The fraction of overlapping features (dextran-positive lysosomes containing LIMP2-GFP) was determined for both control and Arl8b-expressing cells. n = 10–13 cells for each condition from three independent experiments. (d) The expression of LIMP2-GFP was assessed by flow cytometry. The gating of mock-transfected or LIMP2-GFP–transfected cells is shown. (e) Quantification of GFP fluorescence in cells expressing LIMP2 or LIMP2 and Arl8b, gated as illustrated in d. Error bars represent SEM. n = 3 independent experiments.
Figure 8.
Assessment of lysosomal mobility by photoactivation. (a) Lysosomes were loaded with Alexa Fluor 647–dextran (purple) and CMNB-caged carboxyfluorescein-dextran. A ROI (indicated by solid white circle) was selectively illuminated using a 405-nm laser to photoactivate the CMNB-caged carboxyfluorescein-dextran (green in middle and right panels). The resulting fluorescence was imaged using a 488-nm laser every 1 min for 30 min or every 4 min for 2 h. Photoactivated lysosomes were tracked using Imaris software (right). (b) Lysosomes were tracked in cells where CMNB-caged carboxyfluorescein-dextran was photoactivated in either the cell center or the cell periphery. The total track length over 30 min was quantified. Error bars represent SEM (n = 104–204 lysosomes from three to five cells from five independent experiments). (c) The net displacement over 2 h was quantified. Error bars represent SEM (n = 137–285 lysosomes from three to seven cells from two independent experiments).
Figure 9.
Peripheral lysosomes exhibit lower cathepsin L activity than central lysosomes. (a) Lysosomes were loaded with Alexa Fluor 647–dextran (not depicted) and incubated with Magic Red cathepsin L substrate (shown in gray/white). On the right, lysosomes were alkalinized with NH4Cl before Magic Red addition. Cells were imaged by confocal microscopy. Bars, 10 µm. (b) Cathepsin L activity was quantified in untreated and NH4Cl-treated cells by normalizing Magic Red fluorescence to Alexa Fluor 647–dextran fluorescence. n = 15–17 cells for each condition from three independent experiments. (c) Lysosomes were loaded with Alexa Fluor 647–dextran followed by transfection with EGFP or dynamitin-EGFP. Finally, the cells were incubated with Magic Red cathepsin L substrate and imaged by confocal microscopy. Cathepsin L activity (left y axis, unshaded bars) was quantified by normalizing Magic Red fluorescence to Alexa Fluor 647–dextran fluorescence. n = 20–26 cells for each condition from three independent experiments. The fraction of peripheral lysosomes (right y axis, shaded bars) was determined using Volocity software. The boundary of the cells was determined and was degraded inward by 9.1 µm to create two shells. The fraction of total lysosomes in the outermost shell for control cells and dynamitin-EGFP–expressing cells was determined and plotted. n = 13 from three independent experiments. Error bars represent SEM.
Comment in
- Lysosomes relax in the cellular suburbs.
Gowrishankar S, Ferguson SM. Gowrishankar S, et al. J Cell Biol. 2016 Mar 14;212(6):617-9. doi: 10.1083/jcb.201602082. J Cell Biol. 2016. PMID: 26975848 Free PMC article.
Similar articles
- RILP regulates vacuolar ATPase through interaction with the V1G1 subunit.
De Luca M, Cogli L, Progida C, Nisi V, Pascolutti R, Sigismund S, Di Fiore PP, Bucci C. De Luca M, et al. J Cell Sci. 2014 Jun 15;127(Pt 12):2697-708. doi: 10.1242/jcs.142604. Epub 2014 Apr 24. J Cell Sci. 2014. PMID: 24762812 - The Rab7 effector PLEKHM1 binds Arl8b to promote cargo traffic to lysosomes.
Marwaha R, Arya SB, Jagga D, Kaur H, Tuli A, Sharma M. Marwaha R, et al. J Cell Biol. 2017 Apr 3;216(4):1051-1070. doi: 10.1083/jcb.201607085. Epub 2017 Mar 21. J Cell Biol. 2017. PMID: 28325809 Free PMC article. - Collapse of late endosomal pH elicits a rapid Rab7 response via the V-ATPase and RILP.
Mulligan RJ, Magaj MM, Digilio L, Redemann S, Yap CC, Winckler B. Mulligan RJ, et al. J Cell Sci. 2024 May 1;137(9):jcs261765. doi: 10.1242/jcs.261765. Epub 2024 May 13. J Cell Sci. 2024. PMID: 38578235 Free PMC article. - A new V-ATPase regulatory mechanism mediated by the Rab interacting lysosomal protein (RILP).
De Luca M, Bucci C. De Luca M, et al. Commun Integr Biol. 2014 Oct 31;7(5):e971572. doi: 10.4161/cib.29616. eCollection 2014 Oct. Commun Integr Biol. 2014. PMID: 26843904 Free PMC article. Review. - Lysosomal acidification mechanisms.
Mindell JA. Mindell JA. Annu Rev Physiol. 2012;74:69-86. doi: 10.1146/annurev-physiol-012110-142317. Annu Rev Physiol. 2012. PMID: 22335796 Review.
Cited by
- Deregulation of signalling in genetic conditions affecting the lysosomal metabolism of cholesterol and galactosyl-sphingolipids.
Gowrishankar S, Cologna SM, Givogri MI, Bongarzone ER. Gowrishankar S, et al. Neurobiol Dis. 2020 Dec;146:105142. doi: 10.1016/j.nbd.2020.105142. Epub 2020 Oct 17. Neurobiol Dis. 2020. PMID: 33080336 Free PMC article. Review. - The Lysosome as a Regulatory Hub.
Perera RM, Zoncu R. Perera RM, et al. Annu Rev Cell Dev Biol. 2016 Oct 6;32:223-253. doi: 10.1146/annurev-cellbio-111315-125125. Epub 2016 Aug 3. Annu Rev Cell Dev Biol. 2016. PMID: 27501449 Free PMC article. Review. - Can endolysosomal deacidification and inhibition of autophagy prevent severe COVID-19?
Morris G, Athan E, Walder K, Bortolasci CC, O'Neil A, Marx W, Berk M, Carvalho AF, Maes M, Puri BK. Morris G, et al. Life Sci. 2020 Dec 1;262:118541. doi: 10.1016/j.lfs.2020.118541. Epub 2020 Oct 6. Life Sci. 2020. PMID: 33035581 Free PMC article. Review. - Autophagy activation can partially rescue proteasome dysfunction-mediated cardiac toxicity.
Papanagnou ED, Gumeni S, Sklirou AD, Rafeletou A, Terpos E, Keklikoglou K, Kastritis E, Stamatelopoulos K, Sykiotis GP, Dimopoulos MA, Trougakos IP. Papanagnou ED, et al. Aging Cell. 2022 Nov;21(11):e13715. doi: 10.1111/acel.13715. Epub 2022 Oct 19. Aging Cell. 2022. PMID: 36259256 Free PMC article. - Highly selective fluorescent probe with an ideal pH profile for the rapid and unambiguous determination of subcellular labile iron (III) pools in human cells.
Alhawsah B, Yan B, Aydin Z, Niu X, Guo M. Alhawsah B, et al. Anal Lett. 2022;55(12):1954-1970. doi: 10.1080/00032719.2022.2039932. Epub 2022 Mar 31. Anal Lett. 2022. PMID: 36310627 Free PMC article.
References
Publication types
MeSH terms
Substances
LinkOut - more resources
Full Text Sources
Other Literature Sources

