Mfsd2a Is a Transporter for the Essential ω-3 Fatty Acid Docosahexaenoic Acid (DHA) in Eye and Is Important for Photoreceptor Cell Development - PubMed (original) (raw)
. 2016 May 13;291(20):10501-14.
doi: 10.1074/jbc.M116.721340. Epub 2016 Mar 22.
Jia Pei Chan 1, Amaury Cazenave-Gassiot 2, Rebecca W Poh 3, Juat Chin Foo 2, Dwight L A Galam 1, Sujoy Ghosh 4, Long N Nguyen 5, Veluchamy A Barathi 6, Sia W Yeo 7, Chi D Luu 8, Markus R Wenk 2, David L Silver 9
Affiliations
- PMID: 27008858
- PMCID: PMC4865901
- DOI: 10.1074/jbc.M116.721340
Mfsd2a Is a Transporter for the Essential ω-3 Fatty Acid Docosahexaenoic Acid (DHA) in Eye and Is Important for Photoreceptor Cell Development
Bernice H Wong et al. J Biol Chem. 2016.
Abstract
Eye photoreceptor membrane discs in outer rod segments are highly enriched in the visual pigment rhodopsin and the ω-3 fatty acid docosahexaenoic acid (DHA). The eye acquires DHA from blood, but transporters for DHA uptake across the blood-retinal barrier or retinal pigment epithelium have not been identified. Mfsd2a is a newly described sodium-dependent lysophosphatidylcholine (LPC) symporter expressed at the blood-brain barrier that transports LPCs containing DHA and other long-chain fatty acids. LPC transport via Mfsd2a has been shown to be necessary for human brain growth. Here we demonstrate that Mfsd2a is highly expressed in retinal pigment epithelium in embryonic eye, before the development of photoreceptors, and is the primary site of Mfsd2a expression in the eye. Eyes from whole body Mfsd2a-deficient (KO) mice, but not endothelium-specific Mfsd2a-deficient mice, were DHA-deficient and had significantly reduced LPC/DHA transport in vivo Fluorescein angiography indicated normal blood-retinal barrier function. Histological and electron microscopic analysis indicated that Mfsd2a KO mice exhibited a specific reduction in outer rod segment length, disorganized outer rod segment discs, and mislocalization of and reduction in rhodopsin early in postnatal development without loss of photoreceptors. Minor photoreceptor cell loss occurred in adult Mfsd2a KO mice, but electroretinography indicated visual function was normal. The developing eyes of Mfsd2a KO mice had activated microglia and up-regulation of lipogenic and cholesterogenic genes, likely adaptations to loss of LPC transport. These findings identify LPC transport via Mfsd2a as an important pathway for DHA uptake in eye and for development of photoreceptor membrane discs.
Keywords: blood-brain barrier; blood-retinal barrier; lysophospholipid; membrane transport; photoreceptor; retina metabolism; retinal degeneration; transporter; vascular; ω-3 fatty acids.
© 2016 by The American Society for Biochemistry and Molecular Biology, Inc.
Figures
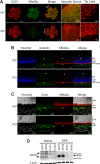
FIGURE 1.
Mfsd2a is expressed in retinal vessels and RPE. A, immunolocalization of Mfsd2a in capillaries of the developing eye. Retinal whole mounts were prepared from postnatal day 8 wild-type (WT) and Mfsd2a deficient (KO) mice and stained for the endothelial cell marker Cd31 and Mfsd2a. Mfsd2a KO served as a negative control for Mfsd2a antibody specificity. Endothelial tip cells are seen at the leading edge of the growing vasculature sprouts (white arrows). Mfsd2a is shown to be expressed only in mature capillaries but is absent in tip cells. WT, n = 4; KO, n = 4; scale bar = 1 mm. B, cross-sections of eyes of postnatal day 14 (P14) mice were stained for isolectin, an endothelial marker, Mfsd2a, and Hoechst (a nuclear stain). Co-expression is seen in the capillaries (white arrow) and RPE (yellow arrow). Autofluorescence is observed in photoreceptor outer segments. WT, n = 5; KO, n = 5; scale bar, 50 μm. C, to confirm Mfsd2a expression in the RPE, eye sections from P14 mice were stained for ezrin, an apical and basolateral membrane marker in RPE, and Mfsd2a, and Hoechst (a nuclear stain). Co-expression is seen at the basolateral membrane (yellow arrow). Autofluorescence is observed in photoreceptor outer segments. WT, n = 5; KO, n = 5; scale bar, 20 μm. D, representative Western blot of Mfsd2a expression in 80 μg of retina and 8 μg of RPE (eye cup without retina) in 8-week-old mice. Mfsd2a is more abundantly expressed in RPE relative to the retina. β-Actin served as a loading control. WT, n = 4; KO, n = 4. INL, inner nuclear layer; PR, photoreceptor.
FIGURE 2.
BRB and BBB are not leaky in Mfsd2a KO mice. A, representative image from fundus fluorescein angiography performed on 3-month-old wild-type and Mfsd2a KO mice. Fluorescein tracer was not observed outside of capillaries in Mfsd2a KO retina indicating intact BRB. WT, n = 5; KO n = 5. B, intracardiac perfusion of Sulfo-NHS-Biotin was carried out on P22–P24 mice, and retinal flat mounts were stained for biotin adducts and isolectin (an endothelial marker). No biotin adducts were observed outside of retinal capillaries, indicating intact BRB. Scale bar, 100 μm. WT, n = 2; KO, n = 2. C, brains harvested from animals in B were sectioned and stained for biotin adducts and Hoechst (a nuclear stain). No biotin adducts were observed outside of brain capillaries in the brain cortex, indicating intact BBB. WT, n = 2; KO, n = 2, scale bar, 20 μm. D, 10-kDa dextran tracer was injected intravenously into P21 mice, and brains were harvested without perfusion 2–3 h post-injection. Brain sections were stained for the endothelial cell marker Cd31 and Hoechst (a nuclear stain). Co-expression of Cd31 and 10-kDa dextran tracer is seen in the capillaries (white arrow). No tracer was observed outside of brain capillaries in the brain cortex, indicating intact BBB. Scale bar, 20 μm. WT, n = 2; KO, n = 2.
FIGURE 3.
Eyes of Mfsd2a KO mice are DHA-deficient with decreased uptake of radiolabeled LPC-[14C]DHA. A, comprehensive lipidomic analysis of whole eyes from 8-week-old mice. Total DHA and arachidonic acid (AA) levels in eye phospholipids are shown. WT, n = 5; KO, n = 4. ***, p < 0.0001; *, p = 0.0167. B, 4 week old mice were injected intravenously with the same dose of LPC-[14C]DHA. Eye cup, brain, and heart were collected 18 h post-injection for lipid extraction, and DPM was quantified using scintillation counting. Uptake is expressed as mean ± S.E. WT, n = 4; KO, n = 4. ***, p < 0.0001; **, p < 0.006.
FIGURE 4.
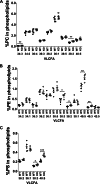
Comprehensive lipidomic analysis of phospholipid pools containing unsaturated fatty acids of whole eyes from 8-week-old wild-type and Mfsd2a KO mice. Percentage of very long chain unsaturated fatty acid (VLCFA) species in phosphatidylcholine (PC) (A), phosphatidylethanolamine (PE) (B), and phosphatidylserine (PS) (C) in eye phospholipids are shown. Fatty acid identity is designated as number of carbons/number of double bonds; e.g. 40:5 indicates a phospholipid with 40 carbons and 5 double bonds. WT, n = 5; KO, n = 4. ***, p < 0.001; **, p < 0.01; **, p < 0.05.
FIGURE 5.
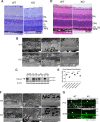
Mfsd2a deficiency results in shortened and disorganized OS and swollen RPE. A, plastic sections of eyes of 4-month-old mice. Toluidine blue staining was carried out to visualize the layers, as indicated to the right of the figure. OS of Mfsd2a KO mice appear thinner and more disorganized, with some ONL loss, although the other retinal layers appear comparable with wild type. Scale bar, 50 μm. B, S.E. images from 4-month-old mice show the disorganization of the OS in Mfsd2a KO mice, and RPE appears swollen. Scale bar, 2 μm. The middle panel shows that villi of wild-type RPE is in close contact with the OS (black arrow), but villi of Mfsd2a KO appears collapsed and not interacting with OS (black arrow). Scale bar, 2 μm. The far right panel is of the basal membrane of the RPE. Edema was seen at the basal infoldings of Mfsd2a KO RPE but not in wild-type RPE (yellow arrow). Scale bar, 1 μm. C, representative Western blot of Mfsd2a expression in RPE. Mfsd2a is expressed in the RPE as early as E18.5. Mfsd2a KO RPE was used as negative control for some age groups. The age in postnatal days is indicated. D, H&E staining of eyes of P13 mice was carried out to visualize the layers, as indicated to the right of the figure. OS of Mfsd2a KO mice appear thinner, although other retinal layers appear comparable with wild type. Scale bar, 50 μm. WT, n = 4; KO, n = 4. E, ratio of OS to OS + IS was quantified in eyes of P13 and 4.5- and 16-month-old mice. OS are shorter in eyes of Mfsd2a KO mice, as early as age P13, indicating an early onset of reduced OS length. Number of mice per age group used as indicated in graph. ***, p < 0.0001. F, S.E. images from age P13 mice show disorganization of the OS in Mfsd2a KO mice, and RPE appears swollen. Scale bar, 2 μm. The middle panel shows that villi Mfsd2a KO RPE appear thickened and interspersed with OS that are not formed properly relative to those seen in WT (white arrow). Scale bar, 2 μm. The far right panel is of the basal membrane of the RPE, where edema was also seen at the basal infoldings of Mfsd2a KO RPE but not in wild-type RPE (yellow arrow). Scale bar, 1 μm. G, immunolocalization of ezrin was performed on eye sections taken from P13 and 5-month-old mice. At age P13, Mfsd2a KO villi appears disorganized and collapsed onto itself at 5 months of age (white arrows). Scale bar, 20 μm. P13, n = 3 per genotype. INL, inner nuclear layer; IS, inner segment; PR, photoreceptor; AM, apical membrane; BI, basal infoldings.
FIGURE 6.
Mfsd2a deficiency results in activated microglia and up-regulation of microglia/interferon pathway. A, S.E. images from 3-month-old mice show large gaps in the subretinal space (black arrow). Scale bar, 2 μm. The middle panel shows a phagocytic cell (white arrow). Scale bar, 2 μm. The far right panel shows an example of a phagocytic cell containing OS discs in an endosome (yellow arrow). Scale bar, 1 μm. AM, apical membrane; BI, basal infoldings. B, immunolocalization of the microglia/macrophage marker Iba-1 was performed on eye sections from P14 mice. Iba-1-positive cells, which normally reside in the inner eye, were found in the subretinal space (yellow arrow). Scale bar, 50 μm. C, immunolocalization of Iba-1 as done in B. Iba-1-positive cells appeared rounder and less ramified compared with WT, indicative of an activated state. Scale bar = 50 μm. WT, n = 5; KO, n = 5. GCL, ganglion cell layer; INL, inner nuclear layer. D, gene microarray analysis from P13 eye cups of WT and Mfsd2a KO mice. An MA plot, which is used to visualize intensity-dependent ratio of raw gene microarray data, indicated that the third highest ranked pathway that was up-regulated in Mfsd2a KO eyes was the microglia/interferon pathway. Purple dots represent individual targets in this pathway over the background of expressed genes.
FIGURE 7.
Mfsd2a deficiency does not result in significant loss of visual function. A, ERG waveforms taken at different stimulus intensities indicate that 4-month-old Mfsd2a KO mice have small but non-significant reductions in visual function relative to WT mice. WT, n = 6; KO, n = 6. B, A-wave and B-wave amplitude expressed as mean ± S.E. indicate that Mfsd2a KO mice have small but non-significant reductions in visual function. WT, n = 6; KO, n = 6. C, representative Western blot of some key proteins involved in phototransduction in whole eyes in 5-week-old mice. Expression levels are similar between wild-type and Mfsd2a KO mice. β-Actin served as a loading control. WT, n = 2; KO, n = 3. D, representative Western blot of two key proteins involved in retinol metabolism in the visual cycle in whole eyes in 8-week-old mice. Expression levels are similar between wild-type and Mfsd2a KO mice. GAPDH served as a loading control. WT, n = 3; KO, n = 3.
FIGURE 8.
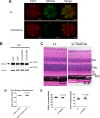
Mfsd2a deficiency in retina vasculature does not contribute to eye DHA accretion or photoreceptor survival. A, immunolocalization of Mfsd2a in capillaries of the developing eye. Retinal whole mounts were prepared from postnatal day 9 Mfsd2a floxed (LL) and LLTie2Cre mice and stained for the endothelial cell marker Cd31 and Mfsd2a. Mfsd2a is shown to be expressed only in capillaries of LL mice but absent in LLTie2Cre mice, consistent with deletion in retina vasculature. Scale bar, 1 mm. LL, n = 2; LLTie2Cre, n = 2. B, representative Western blot of Mfsd2a expression in RPE (eye cup without retina) of 6-week-old mice. As expected, Mfsd2a levels are similar between LL and LLTie2Cre RPE. β-Actin served as a loading control. LL, n = 2; LLTie2Cre, n = 2. C, H&E staining of eyes of 4-month-old mice was carried out to visualize the layers. Although eyes of LLTie2Cre mice appear slightly smaller, retina layers appear comparable with LL control. LL, n = 3; LLTie2Cre, n = 4. Scale bar, 50 μm. D, ratio of OS to OS + IS was quantified in eyes of 4-month-old mice. Ratios of OS length are comparable between eyes of LL and LLTie2Cre mice. LL, n = 3; LLTie2Cre, n = 3. E, comprehensive lipidomic analysis of whole eyes from 7-week-old mice. Total DHA and AA levels in eye phospholipids are expressed as mean ± S.E. of the percentage of the total level of phospholipids. LL, n = 5; LLTie2Cre, n = 5.
FIGURE 9.
Mfsd2a deficiency results in reduced rhodopsin levels and mislocalization and up-regulation of lipogenesis pathways. A, representative Western blot of rhodopsin expression in whole eyes in P13 and 2-month-old mice. Reduced rhodopsin expression is seen in Mfsd2a KO mice as early as P13. Black arrows indicate monomeric and dimeric rhodopsin. P13, n = 2 per genotype; 2-month-old mice, n = 4 per genotype. B, immunolocalization of rhodopsin was performed on eye sections from P14 mice. Rhodopsin, which normally resides in the OS, as seen in WT, was found to be mislocalized to the ONL layer in Mfsd2a KO retina. Scale bar, 20 μm. WT, n = 5; KO, n = 5. C, gene microarray analysis from P13 eye cups of WT and Mfsd2a KO mice. An MA plot, which is used to visualize intensity-dependent ratio of raw gene microarray data, indicated that the top predicted up-regulated genes in Mfsd2a KO eyes are the lipogenic and cholesterogenic Srebp1 and Srebp2 pathways, respectively. Purple dots on each graph represent individual Srebp1 and Srebp2 targets over the background of expressed genes. D, quantitative-PCR was carried out on selected panel to validate gene array findings. WT, n = 4; KO, n = 4. ***, p < 0.0001; **, p < 0.01; *, p < 0.05. PR, photoreceptor.
Similar articles
- Mfsd2a is a transporter for the essential omega-3 fatty acid docosahexaenoic acid.
Nguyen LN, Ma D, Shui G, Wong P, Cazenave-Gassiot A, Zhang X, Wenk MR, Goh EL, Silver DL. Nguyen LN, et al. Nature. 2014 May 22;509(7501):503-6. doi: 10.1038/nature13241. Epub 2014 May 14. Nature. 2014. PMID: 24828044 - Disrupted Blood-Retina Lysophosphatidylcholine Transport Impairs Photoreceptor Health But Not Visual Signal Transduction.
Lobanova ES, Schuhmann K, Finkelstein S, Lewis TR, Cady MA, Hao Y, Keuthan C, Ash JD, Burns ME, Shevchenko A, Arshavsky VY. Lobanova ES, et al. J Neurosci. 2019 Dec 4;39(49):9689-9701. doi: 10.1523/JNEUROSCI.1142-19.2019. Epub 2019 Nov 1. J Neurosci. 2019. PMID: 31676603 Free PMC article. - The lysolipid transporter Mfsd2a regulates lipogenesis in the developing brain.
Chan JP, Wong BH, Chin CF, Galam DLA, Foo JC, Wong LC, Ghosh S, Wenk MR, Cazenave-Gassiot A, Silver DL. Chan JP, et al. PLoS Biol. 2018 Aug 3;16(8):e2006443. doi: 10.1371/journal.pbio.2006443. eCollection 2018 Aug. PLoS Biol. 2018. PMID: 30074985 Free PMC article. - Mfsd2a: A Physiologically Important Lysolipid Transporter in the Brain and Eye.
Wong BH, Silver DL. Wong BH, et al. Adv Exp Med Biol. 2020;1276:223-234. doi: 10.1007/978-981-15-6082-8_14. Adv Exp Med Biol. 2020. PMID: 32705603 Review. - Marine Fish-Derived Lysophosphatidylcholine: Properties, Extraction, Quantification, and Brain Health Application.
Ahmmed MK, Hachem M, Ahmmed F, Rashidinejad A, Oz F, Bekhit AA, Carne A, Bekhit AEA. Ahmmed MK, et al. Molecules. 2023 Mar 30;28(7):3088. doi: 10.3390/molecules28073088. Molecules. 2023. PMID: 37049852 Free PMC article. Review.
Cited by
- Transgenic animal models to explore and modulate the blood brain and blood retinal barriers of the CNS.
Goncalves A, Antonetti DA. Goncalves A, et al. Fluids Barriers CNS. 2022 Nov 1;19(1):86. doi: 10.1186/s12987-022-00386-0. Fluids Barriers CNS. 2022. PMID: 36320068 Free PMC article. Review. - ADIPOR1 deficiency-induced suppression of retinal ELOVL2 and docosahexaenoic acid levels during photoreceptor degeneration and visual loss.
Osada H, Toda E, Homma K, Guzman NA, Nagai N, Ogawa M, Negishi K, Arita M, Tsubota K, Ozawa Y. Osada H, et al. Cell Death Dis. 2021 May 7;12(5):458. doi: 10.1038/s41419-021-03741-5. Cell Death Dis. 2021. PMID: 33963174 Free PMC article. - Targeted Metabolomic Analysis in Alzheimer's Disease Plasma and Brain Tissue in Non-Hispanic Whites.
Kalecký K, German DC, Montillo AA, Bottiglieri T. Kalecký K, et al. J Alzheimers Dis. 2022;86(4):1875-1895. doi: 10.3233/JAD-215448. J Alzheimers Dis. 2022. PMID: 35253754 Free PMC article. - X-ray crystallography reveals molecular recognition mechanism for sugar binding in a melibiose transporter MelB.
Guan L, Hariharan P. Guan L, et al. Commun Biol. 2021 Aug 2;4(1):931. doi: 10.1038/s42003-021-02462-x. Commun Biol. 2021. PMID: 34341464 Free PMC article.
References
- SanGiovanni J. P., and Chew E. Y. (2005) The role of ω-3 long-chain polyunsaturated fatty acids in health and disease of the retina. Prog. Retin. Eye Res. 24, 87–138 - PubMed
- Kidd P. M. (2007) ω-3 DHA and EPA for cognition, behavior, and mood: clinical findings and structural-functional synergies with cell membrane phospholipids. Altern. Med. Rev. 12, 207–227 - PubMed
- Fliesler S. J., and Anderson R. E. (1983) Chemistry and metabolism of lipids in the vertebrate retina. Prog. Lipid Res. 22, 79–131 - PubMed
- Cunha-Vaz J. (1979) The blood-ocular barriers. Surv. Ophthalmol. 23, 279–296 - PubMed
- Bazan N. G. (2006) Cell survival matters: docosahexaenoic acid signaling, neuroprotection and photoreceptors. Trends Neurosci. 29, 263–271 - PubMed
Publication types
MeSH terms
Substances
LinkOut - more resources
Full Text Sources
Other Literature Sources
Molecular Biology Databases
Research Materials


