RAS signalling through PI3-Kinase controls cell migration via modulation of Reelin expression - PubMed (original) (raw)
RAS signalling through PI3-Kinase controls cell migration via modulation of Reelin expression
Esther Castellano et al. Nat Commun. 2016.
Abstract
RAS signalling through phosphoinositide 3-kinase (PI3-Kinase) has been shown to have an essential role in tumour initiation and maintenance. RAS also regulates cell motility and tumour invasiveness, but the role of direct RAS binding to PI3-Kinase in this remains uncertain. Here, we provide evidence that disruption of RAS interaction with PI3-Kinase p110α decreases cell motility and prevents activation of Rac GTPase. Analysis of gene expression in cells lacking RAS interaction with p110α reveals increased levels of the extracellular matrix glycoprotein Reelin and activation of its downstream pathway resulting in upregulation of E-cadherin expression. Induction of the Reelin/E-cadherin axis is also observed in Kras mutant lung tumours that are regressing due to blockade of RAS interaction with PI3-Kinase. Furthermore, loss of Reelin correlates with decreased survival of lung and breast cancer patients. Reelin thus plays a role in restraining RAS and PI3-kinase promotion of cell motility and potentially tumour metastasis.
Figures
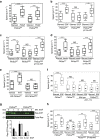
Figure 1. Removal of RAS Interaction with p110α impairs cell motility.
(a–d) Random migration of Pik3caWT, Pik3caRBD and Pik3caRBD containing a WT p110a was analysed by time-lapse video microscopy and cell tracing in the presence or absence of (a) PDGF (20 ng ml−1); (b) EGF (20 ng ml−1); (c) HGF (10 ng ml−1); (d) Insulin (100 ng ml−1). Cells were imaged at 10 min intervals for 18 h. Graphs show migration tracks obtained from 90 cells in each experimental condition. The data are represented as a box and whisker plot in which the box shows the interquartile range that contains values between 25th and 75th percentile. The line inside the box shows the median. The two whiskers show adjacent values. The upper adjacent value (upper mark) is the value of the largest observation that is less than or equal to the upper quartile plus 1.5 the length of the interquartile range. Analogously the lower adjacent value (lower mark) is the value of the smallest observation that is greater than or equal to the lower quartile less 1.5 times the length of interquartile range. Analysis of variance (ANOVA) statistical analysis was performed with starved cells used as reference for each condition (NS, not significant; **P<0.01; ***P<0.001). (e) Random migration assays of Pik3caWT and Pik3caRBD cells containing ER-RAS V12 (tamoxifen-inducible H-RAS V12) treated with 4-hydroxytamoxifen (TX) or vehicle control. ANOVA statistical analysis was performed with starved cells used as reference for each condition (NS, not significant; ***P<0.001). Box and whisker plot was generated as indicated for a. (f) Random migration of Pik3caWT and Pik3caRBD cells was analysed by time-lapse video microscopy and cell tracing in the presence or absence of EGF (20 ng ml−1) and the p110α specific PI3-kinase inhibitor BYL-719 (500 nM). Assay was carried out as described for a. ANOVA statistical analysis was performed with starved cells used as reference for each condition (NS, not significant; ***P<0.001). Box and whisker plot was generated as indicated for a. (g) Pik3caWT (filled bars) and Pik3caRBD (empty bars) MEFs were stimulated with EGF (20 ng ml−1) for the indicated time periods. RAS-GTP activity was established in pull-down assays using GST-RBD of Raf (GST-RafRBD). Both total lysates and proteins bound to GST-RafRBD were analysed by western blot to detect RAS. Lower panel, quantitation of pull-down assays. (h) Random migration of Pik3caWT, Pik3caRBD and Pik3caRBD cells containing ER-MyrAkt was analysed by time-lapse video microscopy and cell tracing in the presence or absence EGF (20 ng ml−1) and 4-hydroxytamoxifen (TX). ANOVA statistical analysis was performed with starved cells used as reference for each condition (NS, not significant; **P<0.01; ***P<0.001). Box and whisker plot was generated as indicated for a.
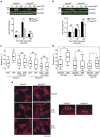
Figure 2. Disruption of RAS interaction with PI3-Kinase disturbs cell polarity and invasion.
(a) Wounded Pik3caWT and Pik3caRBD MEFs monolayers were allowed to migrate for 18 h in the presence or absence EGF (20 ng ml−1) or FBS (10%). Migration was analysed by time-lapse video microscopy. For each condition 90 cells were tracked and persistence in the directionality of migration was analysed using Mathematica software. Analysis of variance (ANOVA) statistical analysis was performed with starved cells used as reference for each condition (NS, not significant; **P<0.05; ***P<0.005). (b) Invasion of Pik3caWT and Pik3caRBD cells in a collagen I matrix in the presence or absence of EGF (0.5 μg ml−1). Stacks are acquired from the bottom of the well over 150 μm upward. Invasion through the collagen layer was monitored in a confocal microscope and analysed using Mathematica software. ANOVA statistical analysis was performed (**P<0.05; ***P<0.005). (c) Invasion of Pik3caWT, Pik3caRBD and Pik3caRBD WT p110α MEFs in transwells containing a layer of matrigel (growth factor reduced matrigel). Invasion was measured in either 0.2% FBS (starved), EGF (50 ng ml−1) or FBS (10%). Invasive cells (on the lower part of the transwell, attached to the membrane) were stained with crystal violet and then lysed using acetic acid. Assays were carried out in triplicate, with error bars indicating s.d. The results of two different experiments are shown. Error bars indicate s.d. (Significance using Student's _t_-test. NS, not significant; **P<0.05; ***P<0.005).
Figure 3. Defects in Rac-GTPase activation in Pik3caRBD cells.
(a) MEFs were stimulated with EGF (20 ng ml−1) for the indicated time periods. Rac-GTP activity was established in pull-down assays using GST-PBD of PAK1 (GST-PBD). Both total lysates and proteins bound to GST-PBD were analysed by western blot to detect Rac. (b) MEFs were stimulated with PDGF (20 ng ml−1) for the indicated time periods and pull-down assays and analysis of the results were done in the same way as described for previous panel. (c) EGF-induced random migration of Pik3caWT and Pik3caRBD cells was analysed by time-lapse video microscopy and cell tracing in the presence or absence of the Rac inhibitor EHT-1864 (5 μM). Analysis of variance (ANOVA) statistical analysis was performed with starved cells used as reference for each condition (NS, not significant; **P<0.01). Box and whisker plot was generated as indicated for Fig. 1a. (d) EGF-induced random migration of Pik3caWT, Pik3caRBD and Pik3caRBD+RacV12 cells was analysed by time-lapse video microscopy and cell tracing. ANOVA statistical analysis was performed with starved cells used as reference for each condition (NS, not significant; **P<0.01). Box and whisker plot was generated as indicated for Fig. 1a. (e) Pik3caWT and Pik3caRBD cells were stimulated with EGF for the denoted time points. immunofluorescence (IF) to detect Rac accumulation in the plasma membrane was performed. DAPI co-staining was carried out to distinguish individual cells. Scale bar, 10 μm. White squares indicate part of the membrane magnified in the right hand images. Arrows indicate direction of cell movement.
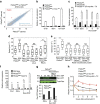
Figure 4. Reelin expression is regulated by RAS-PI3-Kinase pathway and is involved in migration.
(a) Graphical display of statistical analysis performed to identify genes undergoing significant changes of expression in Pik3caRBD cells as compared with wild-type counterparts. Statistically significant probes are shown in light blue (0.05 fdr). Reln reports are shown in red. (b) RNA from steady-state (st-st), serum-starved or EGF-treated (20 ng ml−1) fibroblasts was obtained and Reln mRNA levels measured by quantitative PCR (qPCR). Actin expression was used as an internal control for normalization. Independent triplicates were used for each time point. Error bars indicate mean±s.e.m. (c) Levels of Reln expression were measured by qPCR in Pik3caRBD cells containing an inducible active Akt construct (ER-MyrAKT) in the presence or absence of 4-hydroxytamoxifen (TX; 100 nM). Actin expression was used as an internal control for normalization. Independent triplicates were used for each time point. Error bars indicate mean±s.e.m. (d) Random migration after Reln silencing in Pik3caRBD cells. Migration was analysed by time-lapse video microscopy and cell tracing in the presence or absence of EGF (20 ng ml−1). Box and whisker plot was generated as indicated for Fig. 1a.ANOVA statistical analysis was performed with starved cells used as reference for each condition (NS, not significant; **P<0.01; ***P<0.001). (e) Recombinant Reln (1 μg ml−1) was added to the media of Pik3caWT and Pik3caRBD cells and random migration was then analysed in the same way as described for previous panel. (f) Reln expression levels in Pik3caWT, Pik3caRBD and Pik3caRBD RacV12 cells. Actin expression was used as an internal control for normalization. Independent triplicates were used for each time point. (g) Rac pull-down analysis in the presence of recombinant Reln. Recombinant Reln was added to the media of Pik3caWT MEFs and then Rac-GTP activity was determined in pull-down assays using GST-PBD of PAK1 (GST-PBD). Both total lysates and proteins bound to GST-PBD were analysed by western blot to detect Rac. (h) Representative graph showing Reln mRNA half-life. Pik3caWT, Pik3caRBD, Pik3caRBD p110a WT and Pik3caRBD ER-myrAkt (+TX) cells were treated with actinomycin D and levels of Reln mRNA were determined by qPCR at the displayed time points. Actin expression was used as an internal control for normalization. Independent triplicates were used for each time point.
Figure 5. The Reelin pathway regulates migration in Pik3caRBD cells.
(a) Random migration after dab1 silencing in Pik3caRBD cells. Migration was analysed by time-lapse video microscopy and cell tracing in the presence or absence of EGF (20 ng ml−1). Box and whisker plot was generated as indicated for Fig. 1a. Analysis of variance (ANOVA) statistical analysis was performed with starved cells used as reference for each condition (NS, not significant; ***P<0.001). (b) Random migration after Rap1 silencing in Pik3caRBD cells. Migration assay was performed and analysed as described for previous panel. ANOVA statistical analysis was performed with starved cells used as reference for each condition (NS, not significant; **P<0.01; ***P<0.001). (c) Representative graph showing Cdh1 expression levels in Pik3caWT, Pik3caRBD and Pik3caWT cells 72 h after silencing of p110α. Actin expression was used as an internal control for normalization. The assay was performed three times and each time it was performed in triplicates. Error bars indicate mean±s.e.m. (Significance using Student's _t_-test ***P<0.001). (d) Representative graph showing Cdh1 expression levels in Pik3caRBD cells 72 h after silencing of Reln, Dab1 or Rap1. Actin expression was used as an internal control for normalization. The assay was performed three times and each time it was performed in triplicates. Error bars indicate mean±s.e.m. (e) Representative graph showing Cdh1 expression levels in Pik3caWT, Pik3caRBD and Pik3caRBD RacV12 cells. Actin expression was used as an internal control for normalization. The assay was performed three times and each time it was performed in triplicates. Error bars indicate mean±s.e.m. (Significance using Student's _t_-test ***P<0.001). (f) Random migration after Cdh1 silencing in Pik3caRBD cells. Migration assay was performed and analysed as described for a). Box and whisker plot was generated as indicated for Fig. 1a. ANOVA statistical analysis was performed with starved cells used as reference for each condition (NS, not significant; **P<0.01).
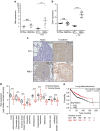
Figure 6. Reelin expression in tumours in mice and clinical data sets.
(a) Reln expression in lung tumours from 7-week-old Pik3caWT/flox, Pik3caRBD/flox, Pik3caWT/− Pik3caRBD/− mice treated and untreated with tamoxifen. All these mice harbour an oncogenic mutation in Kras so they develop lung tumours. Tumours were collected 1 week after the end of tamoxifen treatment. Actin expression was used as an internal control for normalization. (b) E-cadherin expression in lung tumours from 7-week-old Pik3caWT/flox, Pik3caRBD/flox, Pik3caWT/− Pik3caRBD/− mice treated and untreated with tamoxifen. Tumours were collected 1 week after the end of tamoxifen treatment. Actin expression was used as an internal control for normalization. (c) Representative images of Reln and E-cadherin staining of lung sections from Pik3caWT/− Pik3caRBD/− mice. (d) Plot representing human RELN expression values from patients with the tumour types indicated in the figure. (e) Kaplan–Meier graph showing overall survival for lung adenocarcinoma patients with low and high expression of RELN. High and low RELN expression was divided by median.
Similar articles
- ApoER2 and Reelin are expressed in regenerating peripheral nerve and regulate Schwann cell migration by activating the Rac1 GEF protein, Tiam1.
Pasten C, Cerda J, Jausoro I, Court FA, Cáceres A, Marzolo MP. Pasten C, et al. Mol Cell Neurosci. 2015 Nov;69:1-11. doi: 10.1016/j.mcn.2015.09.004. Epub 2015 Sep 16. Mol Cell Neurosci. 2015. PMID: 26386179 - Reelin, Rap1 and N-cadherin orient the migration of multipolar neurons in the developing neocortex.
Jossin Y, Cooper JA. Jossin Y, et al. Nat Neurosci. 2011 Jun;14(6):697-703. doi: 10.1038/nn.2816. Epub 2011 Apr 24. Nat Neurosci. 2011. PMID: 21516100 Free PMC article. - Dab1 expression level controls Reelin-induced PI3K-Akt activation in early GABAergic neurons.
Sajukumar K, Yadav P, Lee GH. Sajukumar K, et al. Biochem Biophys Res Commun. 2025 Mar 5;751:151444. doi: 10.1016/j.bbrc.2025.151444. Epub 2025 Feb 4. Biochem Biophys Res Commun. 2025. PMID: 39919390 - Role of Reelin in the development and maintenance of cortical lamination.
Frotscher M, Chai X, Bock HH, Haas CA, Förster E, Zhao S. Frotscher M, et al. J Neural Transm (Vienna). 2009 Nov;116(11):1451-5. doi: 10.1007/s00702-009-0228-7. Epub 2009 Apr 25. J Neural Transm (Vienna). 2009. PMID: 19396394 Review. - Reelin-Disabled-1 signaling in neuronal migration: splicing takes the stage.
Gao Z, Godbout R. Gao Z, et al. Cell Mol Life Sci. 2013 Jul;70(13):2319-29. doi: 10.1007/s00018-012-1171-6. Epub 2012 Sep 28. Cell Mol Life Sci. 2013. PMID: 23052211 Free PMC article. Review.
Cited by
- Reelin Protects against Colon Pathology via p53 and May Be a Biomarker for Colon Cancer Progression.
Serrano-Morales JM, Vázquez-Carretero MD, García-Miranda P, Carvajal AE, Calonge ML, Ilundain AA, Peral MJ. Serrano-Morales JM, et al. Biology (Basel). 2022 Sep 26;11(10):1406. doi: 10.3390/biology11101406. Biology (Basel). 2022. PMID: 36290310 Free PMC article. - Reelin and APP Cooperatively Modulate Dendritic Spine Formation In Vitro and In Vivo.
Lee HJ, Park JH, Trotter JH, Maher JN, Keenoy KE, Jang YM, Lee Y, Kim JI, Weeber EJ, Hoe HS. Lee HJ, et al. Exp Neurobiol. 2023 Feb 28;32(1):42-55. doi: 10.5607/en22044. Exp Neurobiol. 2023. PMID: 36919335 Free PMC article. - Clinicopathologic characteristics and survival outcome in patients with advanced lung adenocarcinoma and KRAS mutation.
Yang S, Yu X, Fan Y, Shi X, Jin Y. Yang S, et al. J Cancer. 2018 Jul 30;9(16):2930-2937. doi: 10.7150/jca.24425. eCollection 2018. J Cancer. 2018. PMID: 30123361 Free PMC article. - RAS Mediates BET Inhibitor-Endued Repression of Lymphoma Migration and Prognosticates a Novel Proteomics-Based Subgroup of DLBCL through Its Negative Regulator IQGAP3.
Chen CC, Hsu CC, Chen SL, Lin PH, Chen JP, Pan YR, Huang CE, Chen YJ, Chen YY, Wu YY, Yang MH. Chen CC, et al. Cancers (Basel). 2021 Oct 7;13(19):5024. doi: 10.3390/cancers13195024. Cancers (Basel). 2021. PMID: 34638508 Free PMC article. - RNA sequencing-based cell proliferation analysis across 19 cancers identifies a subset of proliferation-informative cancers with a common survival signature.
Ramaker RC, Lasseigne BN, Hardigan AA, Palacio L, Gunther DS, Myers RM, Cooper SJ. Ramaker RC, et al. Oncotarget. 2017 Jun 13;8(24):38668-38681. doi: 10.18632/oncotarget.16961. Oncotarget. 2017. PMID: 28454104 Free PMC article.
References
- Cain R. J. & Ridley A. J. Phosphoinositide 3-kinases in cell migration. Biol. Cell 101, 13–29 (2009). - PubMed
- Raja, Sivamani K., Garcia M. S. & Isseroff R. R. Wound re-epithelialization: modulating keratinocyte migration in wound healing. Front. Biosci. 12, 2849–2868 (2007). - PubMed
- Vicente-Manzanares M. & Horwitz A. R. Cell migration: an overview. Methods Mol. Biol. 769, 1–24 (2011). - PubMed
- Campbell P. M. & Der C. J. Oncogenic Ras and its role in tumor cell invasion and metastasis. Semin. Cancer Biol. 14, 105–114 (2004). - PubMed
- Giehl K. Oncogenic Ras in tumour progression and metastasis. Biol. Chem. 386, 193–205 (2005). - PubMed
Publication types
MeSH terms
Substances
LinkOut - more resources
Full Text Sources
Other Literature Sources
Molecular Biology Databases
Miscellaneous


