A complement-microglial axis drives synapse loss during virus-induced memory impairment - PubMed (original) (raw)
. 2016 Jun 23;534(7608):538-43.
doi: 10.1038/nature18283.
Charise Garber 1, Denise Dorsey 1, Douglas M Durrant 1 2, Bryan Bollman 1, Allison Soung 1, Jinsheng Yu 3, Carlos Perez-Torres 4, Arnaud Frouin 5, Daniel K Wilton 5, Kristen Funk 1, Bette K DeMasters 6, Xiaoping Jiang 7, James R Bowen 8, Steven Mennerick 7, John K Robinson 9, Joel R Garbow 4, Kenneth L Tyler 6, Mehul S Suthar 8, Robert E Schmidt 10, Beth Stevens 5, Robyn S Klein 1 10 11
Affiliations
- PMID: 27337340
- PMCID: PMC5452615
- DOI: 10.1038/nature18283
A complement-microglial axis drives synapse loss during virus-induced memory impairment
Michael J Vasek et al. Nature. 2016.
Abstract
Over 50% of patients who survive neuroinvasive infection with West Nile virus (WNV) exhibit chronic cognitive sequelae. Although thousands of cases of WNV-mediated memory dysfunction accrue annually, the mechanisms responsible for these impairments are unknown. The classical complement cascade, a key component of innate immune pathogen defence, mediates synaptic pruning by microglia during early postnatal development. Here we show that viral infection of adult hippocampal neurons induces complement-mediated elimination of presynaptic terminals in a murine WNV neuroinvasive disease model. Inoculation of WNV-NS5-E218A, a WNV with a mutant NS5(E218A) protein leads to survival rates and cognitive dysfunction that mirror human WNV neuroinvasive disease. WNV-NS5-E218A-recovered mice (recovery defined as survival after acute infection) display impaired spatial learning and persistence of phagocytic microglia without loss of hippocampal neurons or volume. Hippocampi from WNV-NS5-E218A-recovered mice with poor spatial learning show increased expression of genes that drive synaptic remodelling by microglia via complement. C1QA was upregulated and localized to microglia, infected neurons and presynaptic terminals during WNV neuroinvasive disease. Murine and human WNV neuroinvasive disease post-mortem samples exhibit loss of hippocampal CA3 presynaptic terminals, and murine studies revealed microglial engulfment of presynaptic terminals during acute infection and after recovery. Mice with fewer microglia (Il34(-/-) mice with a deficiency in IL-34 production) or deficiency in complement C3 or C3a receptor were protected from WNV-induced synaptic terminal loss. Our study provides a new murine model of WNV-induced spatial memory impairment, and identifies a potential mechanism underlying neurocognitive impairment in patients recovering from WNV neuroinvasive disease.
Figures
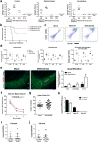
Extended Data Figure 1. Murine intracranial infection with attenuated WNV-NS5-E218A induces similar viral loads and inflammatory response as wild-type WNV-NY99, but greater overall survival
a, Plaque assay for infectious virus (measured in plaque-forming units per g of tissue) performed on dissected brain tissue at various days post-infection with either footpad infection with 102 pfu of WNV-NY99 or intracranial infection with 104 pfu of WNV-NS5-E218A. Each point represents an individual mouse. b, Survival curves of mice infected at 8-weeks-old by the footpad with WNV-NY99 or intracranially with WNV-NY99 or WNV-NS5-E218A. c, Flow cytometric analysis of dissected cortex, hippocampus and cerebellum at 6 dpi with WNV-NY99 and WNV-NS5-E218A with plots for CD45 and CD11b. d, Quantification of flow cytometry data from c. Shown are numbers of leukocytes (CD45high), lymphocytes (CD45high, CD11blow), and activated macrophages and microglia (CD45high, CD11bhigh) compared to mock-infected controls (n = 4 mice per group). e, Immunostaining and counts for TUNEL staining for apoptotic cells with co-staining for the neuronal marker, NeuN, during peak infection (7 dpi) of WNV-NS5-E218A (n = 5) compared to mock-infected controls (n = 4). DG, dentate gyrus, CTX, entorhinal, perirhinal, and visual cortex. f, Some mice were tested at 22 dpi on a three-day version of the Barnes maze, and evaluated for latency to find target hole (*P < 0.05 by repeated measures two-way ANOVA). g, Prior to Barnes maze testing, mice were tested on open field for total lines crossed in 2 min at 21 dpi. h, qPCR for positive strand (non-replicating strand) and negative strand (replicating) WNV envelope protein message remaining in hippocampal tissue at 7, 25 and 52 dpi (n = 13, 4, and 14 mice per group for 7, 25, and 52 dpi, respectively), measured in copies per Gapdh. i, qPCR for positive strand WNV envelope protein at 52 dpi in WNV good learners (fewer than 8 errors on day 2 of Barnes maze, n = 5) and WNV poor learners (greater than 9.5 errors on day 2 of Barnes maze, n = 9). j, qPCR for negative strand WNV envelope protein at 52 dpi in WNV good learners (fewer than 8 errors on day 2 of Barnes maze, n = 5) and WNV poor learners (greater than 9.5 errors on day 2 of Barnes maze, n = 9). Result was not significant by Student’s two-tailed _t_-test.
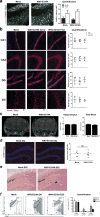
Extended Data Figure 2. At 25–52 days post-WNV-NS5-E218A infection, mice do not show any appreciable loss in brain volume, neuron or astrocyte numbers, or macrophage infiltration
a, Immunostaining for the neuronal marker, NeuN, with TUNEL staining for apoptotic cells within the hippocampus at 52 dpi. Quantification of the number of TUNEL+ neurons and total TUNEL+ cells is shown in mock (n = 3) and WNV-NS5-E218A (n = 6). Scale bar, 20 μm. b, Immunostaining and quantification of the number of NeuN+ neurons per mm2 within the CA1, CA3, dentate gyrus and entorhinal cortex at 25 days after mock (n = 4) or WNV-NS5-E218A infection. WNV-infected animals were subdivided into good (n = 5) and poor (n = 3) learners. Scale bar, 100 μm. c, Post-mortem mouse brains were imaged by MRI at 52 dpi to determine tissue volume of the hippocampus (outlined in red) and total brain (n = 5 mice per group). Scale bar, 1 mm. Not significant by Student’s two-tailed _t_-test (P < 0.05 considered significant). d, Immunostaining for the reactive astrocyte marker, GFAP, shows that WNV-NS5-E218A-infected mice do not exhibit greater hippocampal astrocyte activation than mock-infected controls at 52 dpi. NS, not significant by Student’s two-tailed _t_-test. e, Haematoxylin and eosin (H&E) staining was performed at 52 dpi in WNV-NS5-E218A-recovered and mock-recovered mice. Occasional microglial nodules (arrowhead) surrounded by lymphocytes were observed within the hippocampus. CA1 pyr, CA1 pyramidal layer. f, Flow cytometric analysis of whole brain from mock and WNV-NS5-E218A-infected mice at 8 and 25 dpi was performed to determine numbers of microglia (CD45low, CD11blow), macrophages (CD45high, CD11bhigh), and lymphocytes (CD45high, CD11bnegative). Note the decrease in macrophage population from 7 to 25 dpi.
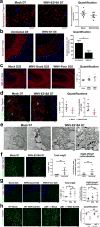
Extended Data Figure 3. Despite synaptic terminal loss, no changes to synaptic terminal size, axons, or astrocyte or antibody association with terminals during WNV infection
a, Immunostaining for the presynaptic marker, synaptophysin, at 7 dpi comparing mock (n = 7) with WNV-NS5-E218A-infected (n = 5) mice. Quantification of synaptophysin+ puncta size was performed within the hippocampal CA3. Scale bar, 10 μm. b, Immunostaining for the presynaptic marker, synapsin1, within the hippocampal CA3 in uninfected controls (n = 3) and footpad-infected WNV-NY-1999 (n = 4) at 8 dpi. Quantification was performed on the numbers of synapsin1+ puncta per mm2 with *P < 0.05 considered significant. c, Immunostaining within the hippocampal CA3 for SMI-31, which detect phosphorylated neurofilament and marks axons at 25 dpi (n = 5–6 mice per group). Quantification of the area of SMI-31 per mm2 (not significant by Student’s _t_-test). d, Immunostaining within the hippocampal CA3 for the presynaptic marker, synaptophysin, co-labelled with the astrocyte marker, S100β at 7 dpi (n = 3 mice per group). Quantification of the percentage of total S100β+ area and synaptophysin+ area colocalized with S100β (not significant by Student’s _t_-test). e, Electron microscopy was performed on hippocampal CA3 sections from day 7 after mock (left panel) or WNV-NS5-E218A (right panels) infection, with immune-DAB enhancement of IBA1. Note the presence of many phagosomes and cytoplasmic inclusions within the WNV-E218A-infected microglia. Electron micrographs shown are representative of n = 3 mice per group. Scale bars, 1 μm. f, Immunostaining for the presynaptic marker, VGlut1, and endogenous murine IgG (mIgG) at 7 days after mock (n = 4) or WNV-NS5-E218A (n = 4) infection. Quantification was performed on the total per cent of mIgG staining area as well as the per cent of VGlut1+ staining area colocalized with mIgG. g, Immunostaining for the postsynaptic marker, Homer1, and endogenous mIgG at 25 days after mock (n = 4) or WNV-NS5-E218A-infection, which were divided into WNV-infected mice which made fewer than 8 errors on day 2 of the Barnes maze (WNV good learners, n = 5) and WNV-infected mice which made greater than 9.5 errors on day 2 of the Barnes maze testing (WNV poor learners, n = 3). Quantification was performed on the total per cent of mIgG staining area as well as the percent of Homer1+ staining area colocalized with mIgG. Significance was determined by Student’s two-tailed _t_-test with P < 0.05 considered as significant. NS, not significant. h, Immunostaining and quantification of number of VGlut1 hippocampal CA3 presynaptic terminals at 7 dpi in wild-type and μMT−/− mice. (*P < 0.05, NS, not significant, by Student’s two-tailed _t_-test). Scale bars, 10 μm.
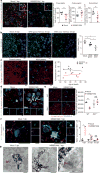
Extended Data Figure 4. WNV infection of human hippocampal CA2/CA3 neurons with loss of synapses within the hippocampal CA1 and the entorhinal cortex
a, Immunostaining of human WNV encephalitis and control post-mortem hippocampal tissue for WNV-antigen. Shown at high magnification are neuron cell bodies (arrows) and neurites (arrowheads) within the hippocampal CA2/CA3 region. b, c, Immunostaining within the hippocampal CA1 (b) or entorhinal cortex (c) for the presynaptic marker, synaptophysin, within human WNV encephalitis and control autopsy cases. Quantification of the per cent of synaptophysin+ area (hippocampal CA1 P = 0.3, entorhinal cortex P = 0.11 by two-tailed Student’s _t_-test (not significant). Scale bar, 20 μm. In one WNV encephalitis patient sample, the entorhinal cortex could not be quantified because it was missing from the section.
Figure 1. WNV-mediated spatial learning and memory impairments and activated microglia persist beyond 45 days post-infection
a, b, At 46 days post-infection (dpi), mock or WNV-NS5-E218A-infected mice underwent 5 days of testing on the Barnes maze spatial learning task. Errors (a) and latency (b) before finding target hole were scored daily (mean of 2 trials per day, ***P < 0.001, *P < 0.05 by repeated measures two-way ANOVA). c, d, At 45 dpi, mice were observed on the open-field test and assessed for locomotor activity (c) and anxiety (d). a–d, Mock (n = 27) and WNV-NS5-E218A-infected (n = 23) mice. e, Mock (n = 23) and WNV-NS5-E218A-infected (n = 26) mice were tested at 22 dpi on a 3-day version of the Barnes maze, and evaluated as in a. f, Immunostaining for IBA1 in control and WNV-NS5-E218A-infected mice at 7 dpi (n = 6 or 7 per group for control or WNV, respectively), 25 dpi (n = 3 or 4 for control or WNV, respectively), and 52 dpi (n = 6 or 4 for control or WNV, respectively) (mean of 2 technical replicates used). g, h, Immunostaining shows increased levels of CD68, a microglial/macrophage lysosomal activation marker, in WNV-NS5-E218A-infected wild-type mice (g) (n = 4 mice per group) and CX3CR1–GFP+/− (h) (n = 3 mice per group) mice. h, CD68 is present within CX3CR1-positive microglia (white arrowheads) and infiltrating macrophages (red arrowheads). Images are representative of at least 3 mice per group. All panels, ***P < 0.001, *P < 0.05, NS, not significant by two-tailed _t_-test, and scale bars, 10 μm, unless otherwise noted. Error bars, s.e.m. Immunostaining and quantification were performed within the hippocampal CA3 region.
Figure 2. Transcriptional profile of good and poor spatial learners during WNV recovery
a, Heat maps show relative expression of significantly altered genes (see Methods) generated from hippocampal microarray of mock vs WNV-NS5-E218A-recovered mice at 25 dpi, each column represents individual mice. b, Validation of select genes and pathways in a unique set of mice by qPCR (mock (n = 5) and WNV-NS5E218A (n = 6) mice). c, Scatter plot depicting number of errors committed on day 2 of Barnes maze testing, showing good (blue) and poor (green) learners among WNV-NS5-E218A-infected and mock-infected (red) controls. d, Principle component analysis of microarray samples separated by groups as in c. WNV, West Nile virus. e, Relative expression heat map showing the top 50 upregulated and 50 downregulated genes by microarray comparing WNV-recovery good and poor learners; each row represents individual mice. f, Venn diagram of microarray data showing number of genes significantly altered from mock-infected controls (P < 0.05, fold change>1.5) in WNV-recovery good or poor learners. g, Validation by qPCR of select genes altered between WNV good learners and WNV poor learners using a separate cohort of mice (mock (n = 5), WNV good (n = 3), and WNV poor (n = 3) mice). All panels, ***P <0.001, *P <0.05, NS, not significant bytwo-tailed _t_-test. Error bars, s.e.m.
Figure 3. West Nile virus causes a loss in hippocampal CA3 synaptic terminals in mice and humans
a, Immunostaining and quantification of colocalized presynpatic and postsynaptic puncta using the markers synaptophysin and Homer1, respectively, at 7 dpi in wild-type mice (mock (n = 7) and WNV-NS5-E218A (n = 9) mice). Data are the mean of 2 staining experiments. b, Immunostaining and quantification of staining area for glutamatergic presynaptic marker, VGlut1, at 25 dpi in mock or WNV-NS5-E218A-recovered mice with good or poor spatial memory performance (mock (n = 3), WNV good (n = 5), and WNV poor (n = 3) mice). c, Immunostaining and quantification of synaptophysin+ area in acute WNV encephalitis patients with age- and sex-matched controls. d, CX3CR1–GFP heterozygous mice were immunostained for synaptophysin and GFP with arrowheads depicting colocalization. Images shown are representative of 3 mice per group. e, Synaptic terminal elimination at 7 dpi is absent in WNV-NS5-E218A-infected Il34_−/_− mice, which have reduced numbers of microglia. f, Immunostaining showing the number of colocalized synaptophysin, LAMP-1 (lysosomal marker), and IBA1 puncta per IBA1+ cell at 7, 25 and 52 dpi. g, Electron micrographs from mock or WNV-NS5-E218A-infected hippocampus at 7 dpi with immune-DAB enhancement of IBA1. An IBA1+ cell is shown surrounding a nearby synapse (right panels, boxed area, red arrowhead). Images shown are representative of 3 mice per group. All panels, ***P <0.001,**P < 0.01, *P< 0.05, NS, not significant, by two-tailed _t_-test. Error bars, s.e.m. Immunostaining, electron microscopy, and quantification performed within the hippocampal CA3 region. Scale bars, 10 μm unless otherwise noted.
Figure 4. Classical complement activation in neurons and microglia drives WNV-mediated synaptic terminal elimination
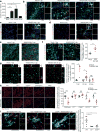
a, qPCR analysis of hippocampal C1qa mRNA normalized to Gapdh in mock (n = 8) or 7 dpi (n = 3), 25 dpi (n = 8) or 52 dpi (n = 7) after WNV-NS5-E218A infection. b, Fluorescent in situ hybridization using RNA probes for neuron specific enolase (NSE) with sense or antisense C1QA coupled with immunostaining for IBA1 in WNV-NS5-E218A-infected or control mice with high magnification insets. Images are representative of 3 mice per group. Scale bars, 50 μm. c, Immunostaining for C1QA protein and IBA1 with high magnification insets. Arrowheads depict colocalization. d, Immunostaining for C1QA protein and WNV antigen at 7 dpi with a WNV-infected neuron shown in high magnification inset. e, Immunostaining for C1QA with neuronal marker, Map2. f, Immunostaining shows colocalization of presynaptic marker, VGlut1, with C3d at 7 dpi (mock (n = 4), WNV-NS5-E218A (n = 6)).g, Immunostaining showing colocalization of C1QA and VGlut1 with representative super-resolution micrographs shown. Scale bars, 5 μm. h, Synaptophysin (Syp) immunostaining in WNV-NS5-E218A-infected wild-type, complement C3-null, complement receptors C3aR-null, CR1/2-null, and CR3-null mice at 7 dpi, normalized to age and genotype-matched, mock-infected controls. i, Immunostaining and quantification of number of colocalized (arrowheads) synaptophysin+, LAMP-1+ (lysosomal marker), and IBA1+ puncta per IBA1+ cell in WNV-NS5-E218A-infected wild-type, C3-null and C3aR-null mice at 7 dpi (fold-change over control). All panels, ***P <0.001, **P< 0.01, *P< 0.05, NS, not significant, by two-tailed _t_-test. Error bars, s.e.m. Immunostaining and quantification performed within the hippocampal CA3 region. Scale bars, 10 μm unless otherwise noted.
Similar articles
- Minocycline Has Anti-inflammatory Effects and Reduces Cytotoxicity in an Ex Vivo Spinal Cord Slice Culture Model of West Nile Virus Infection.
Quick ED, Seitz S, Clarke P, Tyler KL. Quick ED, et al. J Virol. 2017 Oct 27;91(22):e00569-17. doi: 10.1128/JVI.00569-17. Print 2017 Nov 15. J Virol. 2017. PMID: 28878079 Free PMC article. - 2'-O methylation of the viral mRNA cap by West Nile virus evades ifit1-dependent and -independent mechanisms of host restriction in vivo.
Szretter KJ, Daniels BP, Cho H, Gainey MD, Yokoyama WM, Gale M Jr, Virgin HW, Klein RS, Sen GC, Diamond MS. Szretter KJ, et al. PLoS Pathog. 2012;8(5):e1002698. doi: 10.1371/journal.ppat.1002698. Epub 2012 May 10. PLoS Pathog. 2012. PMID: 22589727 Free PMC article. - Intrinsic Innate Immune Responses Control Viral Growth and Protect against Neuronal Death in an Ex Vivo Model of West Nile Virus-Induced Central Nervous System Disease.
Clarke P, Leser JS, Tyler KL. Clarke P, et al. J Virol. 2021 Aug 25;95(18):e0083521. doi: 10.1128/JVI.00835-21. Epub 2021 Aug 25. J Virol. 2021. PMID: 34190599 Free PMC article. - Complement System in Neural Synapse Elimination in Development and Disease.
Presumey J, Bialas AR, Carroll MC. Presumey J, et al. Adv Immunol. 2017;135:53-79. doi: 10.1016/bs.ai.2017.06.004. Epub 2017 Jul 31. Adv Immunol. 2017. PMID: 28826529 Review. - West Nile virus and kidney disease.
Barzon L, Pacenti M, Palù G. Barzon L, et al. Expert Rev Anti Infect Ther. 2013 May;11(5):479-87. doi: 10.1586/eri.13.34. Expert Rev Anti Infect Ther. 2013. PMID: 23627854 Review.
Cited by
- The COVID-19 pandemic and Alzheimer's disease: mutual risks and mechanisms.
Chen F, Chen Y, Wang Y, Ke Q, Cui L. Chen F, et al. Transl Neurodegener. 2022 Sep 11;11(1):40. doi: 10.1186/s40035-022-00316-y. Transl Neurodegener. 2022. PMID: 36089575 Free PMC article. Review. - West Nile Virus-Induced Neurologic Sequelae-Relationship to Neurodegenerative Cascades and Dementias.
Vittor AY, Long M, Chakrabarty P, Aycock L, Kollu V, DeKosky ST. Vittor AY, et al. Curr Trop Med Rep. 2020 Mar;7(1):25-36. doi: 10.1007/s40475-020-00200-7. Epub 2020 Feb 18. Curr Trop Med Rep. 2020. PMID: 32775145 Free PMC article. - Long-Term Consequence of Non-neurotropic H3N2 Influenza A Virus Infection for the Progression of Alzheimer's Disease Symptoms.
Hosseini S, Michaelsen-Preusse K, Schughart K, Korte M. Hosseini S, et al. Front Cell Neurosci. 2021 Apr 28;15:643650. doi: 10.3389/fncel.2021.643650. eCollection 2021. Front Cell Neurosci. 2021. PMID: 33994946 Free PMC article. - The Role of Astrocytes in CNS Inflammation.
Giovannoni F, Quintana FJ. Giovannoni F, et al. Trends Immunol. 2020 Sep;41(9):805-819. doi: 10.1016/j.it.2020.07.007. Epub 2020 Aug 13. Trends Immunol. 2020. PMID: 32800705 Free PMC article. Review. - Multiple Sclerosis: Inflammatory and Neuroglial Aspects.
Papiri G, D'Andreamatteo G, Cacchiò G, Alia S, Silvestrini M, Paci C, Luzzi S, Vignini A. Papiri G, et al. Curr Issues Mol Biol. 2023 Feb 8;45(2):1443-1470. doi: 10.3390/cimb45020094. Curr Issues Mol Biol. 2023. PMID: 36826039 Free PMC article. Review.
References
- Sejvar JJ, et al. Neurologic manifestations and outcome of West Nile virus infection. J Am Med Assoc. 2003;290:511–515. - PubMed
- Stevens B, et al. The classical complement cascade mediates CNS synapse elimination. Cell. 2007;131:1164–1178. - PubMed
Publication types
MeSH terms
Substances
Grants and funding
- U19 AI083019/AI/NIAID NIH HHS/United States
- P30 CA091842/CA/NCI NIH HHS/United States
- F31 NS077640/NS/NINDS NIH HHS/United States
- T32 AI052066/AI/NIAID NIH HHS/United States
- U54 HD090255/HD/NICHD NIH HHS/United States
- R01 AI101400/AI/NIAID NIH HHS/United States
- R01 NS052632/NS/NINDS NIH HHS/United States
LinkOut - more resources
Full Text Sources
Other Literature Sources
Medical
Molecular Biology Databases
Research Materials
Miscellaneous
