LATS-YAP/TAZ controls lineage specification by regulating TGFβ signaling and Hnf4α expression during liver development - PubMed (original) (raw)
doi: 10.1038/ncomms11961.
Jae Oh Park 1, Tae-Shin Kim 1, Sang-Kyum Kim 2, Tack-Hoon Kim 1, Min-Chul Kim 1, Gun Soo Park 1, Jeong-Hwan Kim 3, Shinji Kuninaka 4, Eric N Olson 5, Hideyuki Saya 4, Seon-Young Kim 3, Ho Lee 6, Dae-Sik Lim 1
Affiliations
- PMID: 27358050
- PMCID: PMC4931324
- DOI: 10.1038/ncomms11961
LATS-YAP/TAZ controls lineage specification by regulating TGFβ signaling and Hnf4α expression during liver development
Da-Hye Lee et al. Nat Commun. 2016.
Abstract
The Hippo pathway regulates the self-renewal and differentiation of various adult stem cells, but its role in cell fate determination and differentiation during liver development remains unclear. Here we report that the Hippo pathway controls liver cell lineage specification and proliferation separately from Notch signalling, using mice and primary hepatoblasts with liver-specific knockout of Lats1 and Lats2 kinase, the direct upstream regulators of YAP and TAZ. During and after liver development, the activation of YAP/TAZ induced by loss of Lats1/2 forces hepatoblasts or hepatocytes to commit to the biliary epithelial cell (BEC) lineage. It increases BEC and fibroblast proliferation by up-regulating TGFβ signalling, but suppresses hepatoblast to hepatocyte differentiation by repressing Hnf4α expression. Notably, oncogenic YAP/TAZ activation in hepatocytes induces massive p53-dependent cell senescence/death. Together, our results reveal that YAP/TAZ activity levels govern liver cell differentiation and proliferation in a context-dependent manner.
Figures
Figure 1. _Lats1/2_-deficient hepatoblasts strongly differentiate into BECs but not hepatocytes.
(a) In vitro culture system schematic. (b) Representative bright-field images of BECs obtained from control and L1L2_Alb hepatoblasts subjected to in vitro differentiation for 14 days (upper). Scale bars, 400 μm. The graph shows the mRNA expression levels of cytokeratins 7 and 19 in control and L1L2_Alb iBECs, as assessed by qRT-PCR. The box shows up-regulated or down-regulated gene sets from the RNA-sequencing results with control and L1L2_Alb iBECs. (c) Representative immunofluorescence staining with anti-HNF4α (left) and relative mRNA expression levels of Hnf4α and Cyp7a1 in control and L1L2_Alb iHBs and iHPs, as assessed by qRT-PCR (right). Scale bars, 50 μm. The box shows up-regulated or down-regulated gene sets from the RNA-sequencing results with control and L1L2_Alb iHPs. (d) Relative expression levels of Notch signalling target genes in control and _Lats1/2_-deficient iHBs, iHPs and iBECs. The data are presented as means±s.e.m.; _n_=3 (b,c), *P<0.05 and **P<0.01 (Student's _t_-test).
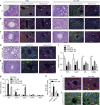
Figure 2. Loss of Lats1 and Lats2 in embryonic livers causes abnormal liver development.
(a–c) Haematoxylin and eosin (H&E) staining (first and fourth column), immunofluorescence staining with anti-CK19, anti-pan-CK and diamidino-2-phenylindole (DAPI; second and fifth column), and anti-HNF4α and DAPI (third and sixth column) of control and L1L2_Alb livers at postnatal day (P) 1 (a), embryonic day (E) E17.5 (b) and E16.5 (c). Black arrows indicate ductal plate cells, and the dotted lines indicate ductal plates. Yellow arrows indicate positive antibody signal; white arrows indicate a lack of staining. Scale bars, 50 μm. (d,e) Representative H&E (left), immunofluorescence staining with anti-CK19 and DAPI (middle) and anti-HNF4α and DAPI (right) result of N1ICD Tg_Alb livers (d) and L1L2RbpJ_Alb livers (e) at P1. Black arrows indicate ductal plate cells, and dotted lines indicate bile ducts. Yellow arrows indicate positive antibody signal; white arrows indicate a lack of staining. Scale bars, 50 μm. (f,g) Relative mRNA expression levels of hepatocyte-related genes (f) and BEC-related genes (g) obtained from P1 livers of the indicated genotypes, as assessed by qRT-PCR. (h) The number of pHH3 (S10)-positive cells out of 100 pan-CK- and HNF4α-expressing cells in P1 control and L1L2_Alb livers. (i,j) Representative immunohistochemical staining results obtained using antibodies against phospho-Histone H3 (S10) and –pan-CK (i) or -HNF4α (j) of control and L1L2_alb livers at P1. Yellow arrows indicate double positive signal. Scale bars, 100 μm. The data are presented as means±s.e.m.; _n_=3, *P<0.05 and **P<0.01 (Student's _t_-test).
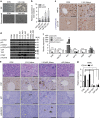
Figure 3. Proper activity of YAP and TAZ are essential for ductal plate expansion.
(a) Representative immunohistochemical staining results obtained with anti-phospho-YAP (S127) and anti-YAP in control and L1L2_Alb livers sampled at E16.5. Black arrows indicate positive signals. (b) Western blot analysis of whole livers obtained at E17.5 from embryos of the indicated genotypes. (c,d) Heat map (c) and qRT-PCR (d) of YAP target genes, reflecting microarray data obtained with mRNAs from control and L1L2_Alb P1 livers. (e,f) Representative images of haematoxylin and eosin (H&E) staining (upper) and immunofluorescence staining (lower) with anti-CK19 and diamidino-2-phenylindole (DAPI) of Lats1−/−; Lats2fl/fl; Yapfl/fl; Alb-Cre (L1L2Yap_Alb), Lats1−/−; Lats2fl/fl; Tazfl/fl; Alb-Cre (L1LTaz_Alb) (e) and Lats1−/−; Lats2fl/fl; Yapfl/fl; Tazfl/fl; Alb-Cre (L1L2YapTaz_Alb) (f) livers at P1. Black dotted lines indicate boundary between ductal plates and non-ductal plates. Black arrows indicate ductal plate cells. Yellow arrows indicate CK19-positive signal. (g) Relative mRNA expression levels of Hnf4α in control, YAP WT, -2SA and -5SA over-expressing iHPs. (h) Quantification of cytokeratin 7 mRNA expression in control, YAP WT, -2SA and -5SA over-expressing iBECs. _n_=2. (i) H&E staining (left) and immunofluorescene staining (right) with anti-CK19 and DAPI of Mst1 and -2 double-knockout livers and Nf2 knockout livers at P1. The graph shows quantification of pan-CK-positive cells per portal triad. Black arrows indicate ductal plate cells, and the dotted lines indicate ductal plates. Yellow arrows indicate positive signals to CK19. Scale bars, 50 μm; the data are presented as means±s.e.m.; _n_=3, *P<0.05 and **P<0.01 (Student's _t_-test).
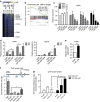
Figure 4. _Lats1/2_-deletion-induced YAP/TAZ activation activates TGFβ signalling.
(a) A signature plot of Tgfβ response up-regulated gene set between _Lats1/2_-deficient and control iBECs, and heat map of mRNA expression levels of Tgfβ response up-regulated genes in control and _Lats1/2_-deleted HBs, iBECs and iHPs. (b) Relative Tgfβ2 mRNA expression in HBs, iHPs and iBECs (left) and P1 livers of control and L1L2_Alb mice (right). (c) Representative immunofluorescence staining results obtained with anti-SMAD2/3 and CK19 in P1 livers. Yellow arrows indicate nuclear SMAD2/3 in CK19-positive cells and white arrow indicates cytoplasmic SMAD2/3 in CK19-positive cells. (d) Chromatin immunoprecipitation (ChIP) analysis of the Tgfβ2 locus in flag-YAP 5SA over-expressing iHPs, as performed with anti-FLAG or –YAP. (e) Relative mRNA expression levels of cytokeratin 7 and 19 in YAP 5SA over-expressing iBECs treated with or without the TGFβ receptor inhibitor, SB431542. (f) Relative mRNA expression levels of Hnf4α in YAP 5SA over-expressing iBECs treated with and without SB431542. Scale bars, 50 μm; the data are presented as means±s.e.m.; _n_=3, *P<0.05 and **P<0.01 (Student's _t_-test).
Figure 5. Loss of Lats1/2 in adult livers causes rapid expansion of immature BECs and activation of TGFβ signalling.
(a,b) Photograph (a) shows livers of adeno-Cre (2X10⁸ PFU)-injected control and Lats1−/−; Lats2fl/fl mice (L1L2_Adeno) and dot graph (b) of liver to body weight ratio of adeno-Cre virus injected livers. (c–f) Representative images of haematoxylin and eosin (H&E) (c), anti-pan-CK (d), Sirius red and Fast green (e) and, anti-SMAD2/3 and anti-CK19 (f) staining of control and L1L2_Adeno livers. Black arrows indicate tubular bile ducts and yellow arrows indicate immature BECs. Red arrows indicate LCCs in hepatocytes. Scale bars in (c) up indicate 100 μm and scale bars in (c) bottom indicate 50 μm. Yellow arrows in d indicate pan-CK-positive signal. White arrows in f indicate cytoplasmic SMAD2/3 signal in CK19-positive cells; Yellow arrows in f indicate nuclear SMAD2/3 signals in CK19-positive cells. Scale bars in d and f indicate 50 μm. (g) Bar graph showing quantification of BrdU-positive cells out of 100 pan-CK- and HNF4α-positive cells. (h) Relative mRNA expression levels of BEC-related genes in control and L1L2_Adeno livers. _n_=4. (i) Relative mRNA expression levels of Tgfβ2 and fibrotic markers in control and L1L2_Adeno livers. The data are presented as means±s.e.m.; _n_=4, *P<0.05, **P<0.01 and ***P<0.005 (Student's _t_-test).
Figure 6. Hyper-activation of YAP induced oncogenic stress-induced senescence or apoptosis, which does not affect hepatocyte differentiation.
(a) Representative bright-field (upper) and phase contrast (lower) images of in vitro differentiated hepatocytes from control cells, L1L2_Alb hepatoblasts (upper, scale bars, 50 μm) and YAP 5SA over-expressing hepatoblasts (lower, scale bars, 100 μm). (b) fluorescence-activated cell sorting (FACS) analysis of in vitro cultured hepatoblasts and hepatocytes. _n_=3. (c) Representative immunohistochemical results obtained with anti-HNF4α (upper) and anti-phospho-γH2ax (S139) (lower) in control and L1L2_Adeno livers. Black arrows indicate normal hepatocytes; red arrows in (c) up indicate LCCs of hepatocytes and red arrows in (c) bottom indicate positive signal to p- γH2AX. Scale bars, 50 μm. (d) Western blot analysis of liver extracts from control and Lats1−/−; Lats2fl/fl mice injected with adeno-Cre (L1L2_Ad; lanes 1–6), Lats2fl/fl; Alb-Cre (L2_Alb; lane 7, HCC) and Mst1fl/fl;Mst2−/−;Alb-Cre (Mst1/2_Alb; lanes 8 and 9, HCC). Asterisk indicates the lysate from livers with highly expanded fibrocytes. (e) Representative images of haematoxylin and eosin (H&E) staining and immunohistochemistry with antibodies against YAP, p21 and pHH3 (S10) in control, L1L2_Adeno, L1L2_p53_Adeno and p53_Adeno livers. In the H&E staining images, black arrows indicate LCCs of hepatocytes. In the immunohistochemical staining images, black arrows indicate positive signal to indicated antibodies and yellow arrows indicate a lack of staining. Scale bars, 50 μm. (f) Relative mRNA expression of hepatic and BEC markers in livers from mice of the indicated genotypes. (g) Relative Hnf4α mRNA expression levels of control, YAP WT, -2SA and -5SA over-expressing iHPs. The data are presented as means±s.e.m.; _n_=3, *P<0.05, **P<0.01 and ***P<0.005 (Student's _t_-test).
Figure 7. YAP represses the hepatic transcription factor Hnf4α, resulting in defective hepatocyte differentiation.
(a) Heat map for genes found to be commonly down-regulated in _Lats1/2_-deficient hepatoblasts, differentiated hepatocytes and BECs. (b) Hnf4α target gene signature plot between control and _Lats1/2_-deficient iHPs. (c) Relative mRNA expression levels of Hnf4α in Aml12 cell lines stably expressing oestrogen receptor fused Yap mutants; control, YAP WT, -2SA and -5SA-ERT2 following their induction by tamoxifen for the indicated times. _n_=2. (d) Relative mRNA expression levels of Hnf4α and Cyp7a1 in YAP 5SA and YAP 5SA 94A (Tead-binding defective) over-expressing iHBs and iHPs. (e) Relative mRNA expression levels of Hnf4α in control and Yap-knockout iHPs. (f,g) chromatin immunoprecipitation (ChIP) analysis of the Hnf4α locus in flag- YAP 5SA over-expressing iHPs, performed using anti-flag or -YAP (f) and anti-CHD4 (g). The data are presented as means±s.e.m.; _n_=3, *P<0.05 (Student's _t_-test).
Similar articles
- Large tumor suppressor homologs 1 and 2 regulate mouse liver progenitor cell proliferation and maturation through antagonism of the coactivators YAP and TAZ.
Yi J, Lu L, Yanger K, Wang W, Sohn BH, Stanger BZ, Zhang M, Martin JF, Ajani JA, Chen J, Lee JS, Song S, Johnson RL. Yi J, et al. Hepatology. 2016 Nov;64(5):1757-1772. doi: 10.1002/hep.28768. Epub 2016 Sep 30. Hepatology. 2016. PMID: 27531557 Free PMC article. - WWC1 and NF2 Prevent the Development of Intrahepatic Cholangiocarcinoma by Regulating YAP/TAZ Activity through LATS in Mice.
Park J, Kim JS, Nahm JH, Kim SK, Lee DH, Lim DS. Park J, et al. Mol Cells. 2020 May 31;43(5):491-499. doi: 10.14348/molcells.2020.0093. Mol Cells. 2020. PMID: 32451369 Free PMC article. - Lats1/2 Regulate Yap/Taz to Control Nephron Progenitor Epithelialization and Inhibit Myofibroblast Formation.
McNeill H, Reginensi A. McNeill H, et al. J Am Soc Nephrol. 2017 Mar;28(3):852-861. doi: 10.1681/ASN.2016060611. Epub 2016 Sep 19. J Am Soc Nephrol. 2017. PMID: 27647853 Free PMC article. - [Regulation of differentiation of mesenchymal stem cells by the Hippo pathway effectors TAZ/YAP].
Men T, Piao SH, Teng CB. Men T, et al. Yi Chuan. 2013 Nov;35(11):1283-90. doi: 10.3724/sp.j.1005.2013.01283. Yi Chuan. 2013. PMID: 24579311 Review. Chinese. - Mutant p53 Protein and the Hippo Transducers YAP and TAZ: A Critical Oncogenic Node in Human Cancers.
Ferraiuolo M, Verduci L, Blandino G, Strano S. Ferraiuolo M, et al. Int J Mol Sci. 2017 May 3;18(5):961. doi: 10.3390/ijms18050961. Int J Mol Sci. 2017. PMID: 28467351 Free PMC article. Review.
Cited by
- Hippo Signaling Pathway in Colorectal Cancer: Modulation by Various Signals and Therapeutic Potential.
Mohammadpour S, Torshizi Esfahani A, Sarpash S, Vakili F, Zafarjafarzadeh N, Mashaollahi A, Pardakhtchi A, Nazemalhosseini-Mojarad E. Mohammadpour S, et al. Anal Cell Pathol (Amst). 2024 Oct 11;2024:5767535. doi: 10.1155/2024/5767535. eCollection 2024. Anal Cell Pathol (Amst). 2024. PMID: 39431199 Free PMC article. Review. - TEAD transcription factor family emerges as a promising therapeutic target for oral squamous cell carcinoma.
Wang S, Shao D, Gao X, Zhao P, Kong F, Deng J, Yang L, Shang W, Sun Y, Fu Z. Wang S, et al. Front Immunol. 2024 Oct 4;15:1480701. doi: 10.3389/fimmu.2024.1480701. eCollection 2024. Front Immunol. 2024. PMID: 39430767 Free PMC article. Review. - Induction of the TEAD Coactivator VGLL1 by Estrogen Receptor-Targeted Therapy Drives Resistance in Breast Cancer.
Gemma C, Lai CF, Singh AK, Belfiore A, Portman N, Milioli HZ, Periyasamy M, Raafat S, Nicholls AJ, Davies CM, Patel NR, Simmons GM, Fan H, Nguyen VTM, Magnani L, Rakha E, Martin LA, Lim E, Coombes RC, Pruneri G, Buluwela L, Ali S. Gemma C, et al. Cancer Res. 2024 Dec 16;84(24):4283-4297. doi: 10.1158/0008-5472.CAN-24-0013. Cancer Res. 2024. PMID: 39356622 Free PMC article. - Liver mechanosignaling as a natural anti-hepatitis B virus mechanism.
Ye J, Li F, Hua T, Ma K, Wang J, Zhao Z, Yang Z, Luo C, Jia R, Li Y, Hao M, Wu J, Lu M, Yuan Z, Zhang J, Chen J. Ye J, et al. Nat Commun. 2024 Sep 27;15(1):8375. doi: 10.1038/s41467-024-52718-3. Nat Commun. 2024. PMID: 39333106 Free PMC article. - A Boolean model explains phenotypic plasticity changes underlying hepatic cancer stem cells emergence.
Hernández-Magaña A, Bensussen A, Martínez-García JC, Álvarez-Buylla ER. Hernández-Magaña A, et al. NPJ Syst Biol Appl. 2024 Sep 2;10(1):99. doi: 10.1038/s41540-024-00422-9. NPJ Syst Biol Appl. 2024. PMID: 39223160 Free PMC article.
References
- Zhao R. & Duncan S. A. Embryonic development of the liver. Hepatology 41, 956–967 (2005). - PubMed
- Si-Tayeb K., Lemaigre F. P. & Duncan S. A. Organogenesis and development of the liver. Dev. Cell 18, 175–189 (2010). - PubMed
Publication types
MeSH terms
Substances
LinkOut - more resources
Full Text Sources
Other Literature Sources
Molecular Biology Databases
Research Materials
Miscellaneous


