Yes-associated protein mediates immune reprogramming in pancreatic ductal adenocarcinoma - PubMed (original) (raw)
Yes-associated protein mediates immune reprogramming in pancreatic ductal adenocarcinoma
S Murakami et al. Oncogene. 2017.
Abstract
Pancreatic ductal adenocarcinoma (PDAC) is characterized by a high degree of inflammation and profound immune suppression. Here we identify Yes-associated protein (Yap) as a critical regulator of the immunosuppressive microenvironment in both mouse and human PDAC. Within Kras:p53 mutant pancreatic ductal cells, Yap drives the expression and secretion of multiple cytokines/chemokines, which in turn promote the differentiation and accumulation of myeloid-derived suppressor cells (MDSCs) both in vitro and in vivo. Pancreas-specific knockout of Yap or antibody-mediated depletion of MDSCs promoted macrophage reprogramming, reactivation of T cells, apoptosis of Kras mutant neoplastic ductal cells and pancreatic regeneration after acute pancreatitis. In primary human PDAC, YAP expression levels strongly correlate with an MDSC gene signature, and high expression of YAP or MDSC-related genes predicts decreased survival in PDAC patients. These results reveal multifaceted roles of YAP in PDAC pathogenesis and underscore its promise as a therapeutic target for this deadly disease.
Figures
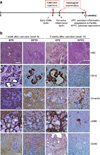
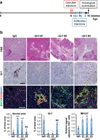
Figure 1. Deletion of Yap in Kras:p53 mutant pancreata results in tissue regeneration following acute pancreatitis
(a) Experimental design and summary of phenotypes at the indicated time points. (b) Representative images of H&E, CK19, Vimentin, αSMA, and CD45 IHC staining of pancreas sections from KPC and KPYC mice at 1 week or 5 weeks post caerulein injections. Scale bar indicates 200 μm.
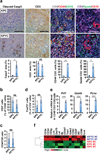
Figure 2. Deletion of Yap reactivates T cells and promotes Kras:Trp53 mutant neoplastic ducts to undergo apoptosis following acute pancreatitis
(a) Representative images and quantification of the percentage of cleaved-Caspase 3 (cleaved Casp3) and CD3 IHC staining, and IF staining for CD3/CD44/CK19 and CD3/Gzmb/CK19 in the pancreas sections from KPC and KPYC mice at 1 week post caerulein injections. Error bars represent standard errors. Scale bar indicates 200 μm. *P<0.05; **P<0.005; NS: not significant. (b) Percentage of CD3+ T cells among total CD45+ leukocytes in pancreata from 9-week-old KPC (n = 6) and KPYC (n = 3) mice at 1 week post caerulein injections as determined by flow cytometry. Error bars indicate standard deviations. NS: not significant. (c) Ratio of CD4/CD8 positive cells in the pancreata of 9-week-old KPC (n = 7) and KPYC (n = 3) mice at 1 week post caerulein injections as determined by flow cytometry. Error bars indicate standard deviations. NS: not significant. (d) Percentage of CD4+FoxP3+ regulatory T cells among total CD4+ leukocytes in pancreata from 9-week-old KPC (n = 4) and KPYC (n = 3) mice at 1 week post caerulein injections as determined by flow cytometry. Error bars indicate standard deviations. NS: not significant. (e) Relative mRNA expression of Prf1, Gzmb, and Pcna in CD45+CD3+CD8+ cytotoxic T cells isolated from pancreata of 9-week-old KPC (n = 3) and KPYC ( n= 4) mice at 1 week post caerulein challenge as determined by qRT-PCR. Error bars indicate standard errors. ***P<0.0005. (f) Heatmap of relative mRNA expression of genes involved in TCR signaling in pancreata from 9-week-old KPC and KPYC mice at 1 week post caerulein injections as determined by microarray analysis.
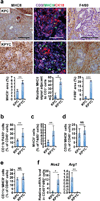
Figure 3. Depletion of Yap enhances infiltration of MHCII+ macrophages in Kras:Trp53 mutant pancreata following acute pancreatitis
(a) Representative images and quantification of the percentage of MHCII and F4/80 IHC staining, and CD3, MHCII and CK19 IF signal intensity in pancreatic sections from 9-week-old KPC and KPYC mice at 1 week post caerulein injections. Error bars indicate standard errors. Scale bar indicates 200 μm. *P<0.05; **P<0.005; ***P<0.0005. (b) Percentage of CD11b+F4/80+ macrophages among total CD45+ leukocytes in pancreata from 9-week-old KPC (n = 6) and KPYC (n = 5) mice at 1 week post caerulein injections as determined by flow cytometry. Error bars indicate standard deviations. **P<0.005. (c) Percentage of MHC II+ cells among CD45+CD11b+F4/80+ macrophages in pancreata from 9-week-old KPC (n = 5) and KPYC (n = 4) mice at 1 week post caerulein injections as determined by flow cytometry. Error bars indicate standard deviations. **P<0.005. (d) Percentage of CD19+MHCII+ B-cells among total CD45+ leukocytes in pancreata from 9-week-old KPC (n = 6) and KPYC (n = 4) mice at 1 week post caerulein injections as determined by flow cytometry. Error bars indicate standard deviations.. NS: not significant. (e) Percentage of CD11c+MHCII+ dendritic cells among total CD45+ leukocytes in pancreata from 9-week-old KPC (n = 3) and KPYC (n = 5) mice at 1 week post caerulein injections as determined by flow cytometry. Error bars indicate standard deviations.. NS: not significant. (f) Relative mRNA expression of Nos2 and Arg in CD45+F4/80+ macrophages isolated from pancreata of 9-week-old KPC (n = 3) and KPYC (n = 7) animals at 1 week post caerulein challenge as determined by qRT-PCR. Error bars indicate standard errors. *P<0.05; **P<0.005.
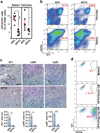
Figure 4. Yap knockout blocks accumulation of MDSCs in the spleen and pancreata of Kras:Trp53 mutant mice following acute pancreatitis
(a) Percentage of of Gr1+CD11b+ MDSC cells among total CD45+ leukocytes in spleens and pancreata from 9-week-old KPC (spleen, n = 8; pancreas, n = 7) and KPYC (spleen, n = 6; pancreas, n = 5) mice at 1 week post caerulein injections as determined by flow cytometry. Symbols represent data from individual mice, and bars show the mean. Error bars indicate standard deviations. *P<0.05; ***P<0.0005. (b) Representative plots of flow cytometry analysis of Gr1+CD11b+ MDSC. The percentage of Gr1+CD11b+ cells among all CD45+ leukocytes is indicated in red. (c) Representative images and quantification of the percentage of Gr1, Ly6C, and Ly6G IHC staining in pancreatic sections from 9-week-old KPC and KPYC mice at 1 week post caerulein challenge. Error bars indicate standard errors. Scale bar indicates 200 μm. *P<0.05; ***P<0.0005. (d) Representative plots of flow cytometry analysis of Gr1+CD11b+ MDSC cells following 5 days of incubation of WT bone marrow cells with control medium or conditioned medium (CM) from KPYC cells transduced with vector control or Flag-Yap. The Gr1+CD11b+ population is gated and the percentage among all CD45+ leukocytes is indicated in red. Error bars indicate standard errors.
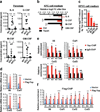
Figure 5. Silencing of Yap in Kras:Trp53 mutant PDAC cells inhibits the transcription and secretion of MDSC-polarizing cytokines
(a) Quantification of indicated cytokines in pancreata from 9-week-old WT (n = 3), KPC (n =6), and KPYC (n = 7) mice at 1 week post caerulein injection as determined by ELISA. Symbols represent data from individual mice, and bars show the mean. Error bars indicate standard deviation. *P<0.05; **P<0.005; ***P<0.0005. (b) Relative log2 fold changes (FC) of indicated cytokines in the conditioned media (CM) of KPC PDAC cells harboring pTRIPZ empty vector (Ctrl) or pTRIPZ-shYap (Yapsh) after addition of Dox. Error bars indicate standard deviation. *P<0.05; ***P<0.0005. (c) Relative log2 FC of indicated cytokines in the CM from KPYC cells re-expressing Yap compared to CM from KPYC control cells. Error bars indicate standard deviation. *P<0.05; **P<0.005; NS: not significant. (d) Relative mRNA expression of indicated genes in KPYC cells introduced with vector control or Flag-Yap as determined by qRT-PCR analysis. Error bars indicate standard error. *P<0.05; ***P<0.0005. (e) qRT-PCR analysis of ChIP with control IgG and Yap antibodies against promoter regions containing putative Tead-binding motifs (S1-3) of indicated genes in KPC PDAC cells. The 3’UTR sequences were used as negative controls. Error bars indicate standard error. *P<0.05; **P<0.005; ***P<0.0005; NS: not significant. (f) qRT-PCR analysis of ChIP with Flag antibodies in KPYC cells introduced with control vector or Flag-Yap using the same set of primers as in (e). Error bars indicate standard error. *P<0.05; **P<0.005; ***P<0.0005.
Figure 6. Depletion of MDSCs restores infiltration of MHCII+ cells and promotes pancreatic regeneration in KC mice
(a) Experimental design. (b) Representative images and quantification of H&E, Gr1 IHC, and MHCII/CD3 IF staining of pancreatic sections from 10-week-old KC mice that were subjected to caerulein and antibody injections as outlined in (a). Error bars represent standard errors. #1-3 indicate three different mice injected with αGr1 antibody. Scale bar indicates 200 μm. *P<0.05; **P<0.005; ***P<0.0005; NS: not significant.
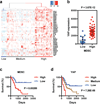
Figure 7. Yap expression correlates with expression of MDSC-related genes and predicts survival in human PDAC
(a) Heatmap of unsupervised hierarchical clustering analysis of expression of 40 MDSC-related genes in TCGA primary PDAC tumor samples with RNAseq expression information (n=179). Three major clusters are identified as “Low” (n=19), “Medium” (n=63), or “High” (n=97) . (b) Relative YAP mRNA levels in TCGA primary PDAC tumors classified as either MDSC “High” or MDSC “Low” as in (a). (c) Kaplan-Meier overall survival curve of PDAC patients with either “High” (n=71) or “Low” (n=16) MDSC expression profiles. (d) Kaplan-Meier survival curve of PDAC patients stratified by Low (n=39), Medium (n=98), or High (n=10) relative YAP expression.
Figure 8. Yap orchestrates an immune suppressive microenvironment in Kras mutant pancreas by promoting the expression of MDSC-promoting cytokines
Schematic representation of the crucial function of Yap as a master switch of an ongenic Kras secretome that promotes the accumulation of immune suppressive MDSCs and TAMs and downregulates antigen-presenting macrophages, leading to suppression of CTLs.
Comment in
- Yes-associated protein and immunosuppressive microenvironment in pancreatic cancer development: a new strategy to improve immunotherapy efficacy?
Berardi R, Bittoni A. Berardi R, et al. J Thorac Dis. 2017 Jul;9(7):1798-1801. doi: 10.21037/jtd.2017.06.60. J Thorac Dis. 2017. PMID: 28839967 Free PMC article. No abstract available.
Similar articles
- Downstream of mutant KRAS, the transcription regulator YAP is essential for neoplastic progression to pancreatic ductal adenocarcinoma.
Zhang W, Nandakumar N, Shi Y, Manzano M, Smith A, Graham G, Gupta S, Vietsch EE, Laughlin SZ, Wadhwa M, Chetram M, Joshi M, Wang F, Kallakury B, Toretsky J, Wellstein A, Yi C. Zhang W, et al. Sci Signal. 2014 May 6;7(324):ra42. doi: 10.1126/scisignal.2005049. Sci Signal. 2014. PMID: 24803537 Free PMC article. - A combinatorial strategy using YAP and pan-RAF inhibitors for treating KRAS-mutant pancreatic cancer.
Zhao X, Wang X, Fang L, Lan C, Zheng X, Wang Y, Zhang Y, Han X, Liu S, Cheng K, Zhao Y, Shi J, Guo J, Hao J, Ren H, Nie G. Zhao X, et al. Cancer Lett. 2017 Aug 28;402:61-70. doi: 10.1016/j.canlet.2017.05.015. Epub 2017 May 30. Cancer Lett. 2017. PMID: 28576749 - lncRNA THAP9-AS1 Promotes Pancreatic Ductal Adenocarcinoma Growth and Leads to a Poor Clinical Outcome via Sponging miR-484 and Interacting with YAP.
Li N, Yang G, Luo L, Ling L, Wang X, Shi L, Lan J, Jia X, Zhang Q, Long Z, Liu J, Hu W, He Z, Liu H, Liu W, Zheng G. Li N, et al. Clin Cancer Res. 2020 Apr 1;26(7):1736-1748. doi: 10.1158/1078-0432.CCR-19-0674. Epub 2019 Dec 12. Clin Cancer Res. 2020. PMID: 31831555 - Central role of Yes-associated protein and WW-domain-containing transcriptional co-activator with PDZ-binding motif in pancreatic cancer development.
Rozengurt E, Eibl G. Rozengurt E, et al. World J Gastroenterol. 2019 Apr 21;25(15):1797-1816. doi: 10.3748/wjg.v25.i15.1797. World J Gastroenterol. 2019. PMID: 31057295 Free PMC article. Review. - The Roles of Frequently Mutated Genes of Pancreatic Cancer in Regulation of Tumor Microenvironment.
Sun H, Zhang B, Li H. Sun H, et al. Technol Cancer Res Treat. 2020 Jan-Dec;19:1533033820920969. doi: 10.1177/1533033820920969. Technol Cancer Res Treat. 2020. PMID: 32372692 Free PMC article. Review.
Cited by
- Yes-associated protein contributes to magnesium alloy-derivedinflammation in endothelial cells.
Yu H, Hou Z, Chen N, Luo R, Yang L, Miao M, Ma X, Zhou L, He F, Shen Y, Liu X, Wang Y. Yu H, et al. Regen Biomater. 2022 Jan 20;9:rbac002. doi: 10.1093/rb/rbac002. eCollection 2022. Regen Biomater. 2022. PMID: 35480861 Free PMC article. - Gut Microbiome Directs Hepatocytes to Recruit MDSCs and Promote Cholangiocarcinoma.
Zhang Q, Ma C, Duan Y, Heinrich B, Rosato U, Diggs LP, Ma L, Roy S, Fu Q, Brown ZJ, Wabitsch S, Thovarai V, Fu J, Feng D, Ruf B, Cui LL, Subramanyam V, Frank KM, Wang S, Kleiner DE, Ritz T, Rupp C, Gao B, Longerich T, Kroemer A, Wang XW, Ruchirawat M, Korangy F, Schnabl B, Trinchieri G, Greten TF. Zhang Q, et al. Cancer Discov. 2021 May;11(5):1248-1267. doi: 10.1158/2159-8290.CD-20-0304. Epub 2020 Dec 15. Cancer Discov. 2021. PMID: 33323397 Free PMC article. - Statins Inhibit Inflammatory Cytokine Production by Macrophages and Acinar-to-Ductal Metaplasia of Pancreatic Cells.
Ako S, Teper Y, Ye L, Sinnett-Smith J, Hines OJ, Rozengurt E, Eibl G. Ako S, et al. Gastro Hep Adv. 2022;1(4):640-651. doi: 10.1016/j.gastha.2022.04.012. Epub 2022 Apr 25. Gastro Hep Adv. 2022. PMID: 36313271 Free PMC article. - Intratumoral collagen signatures predict clinical outcomes in feline mammary carcinoma.
Rosen S, Brisson BK, Durham AC, Munroe CM, McNeill CJ, Stefanovski D, Sørenmo KU, Volk SW. Rosen S, et al. PLoS One. 2020 Aug 10;15(8):e0236516. doi: 10.1371/journal.pone.0236516. eCollection 2020. PLoS One. 2020. PMID: 32776970 Free PMC article. - Spatial and Temporal Changes in PD-L1 Expression in Cancer: The Role of Genetic Drivers, Tumor Microenvironment and Resistance to Therapy.
Shklovskaya E, Rizos H. Shklovskaya E, et al. Int J Mol Sci. 2020 Sep 27;21(19):7139. doi: 10.3390/ijms21197139. Int J Mol Sci. 2020. PMID: 32992658 Free PMC article. Review.
References
- Bardeesy N, Sharpless NE, DePinho RA, Merlino G. The genetics of pancreatic adenocarcinoma: a roadmap for a mouse model. Semin Cancer Biol. 2001;11:201–218. - PubMed
MeSH terms
Substances
LinkOut - more resources
Full Text Sources
Other Literature Sources
Medical
Molecular Biology Databases
Research Materials
Miscellaneous
