Simple rules for passive diffusion through the nuclear pore complex - PubMed (original) (raw)
Simple rules for passive diffusion through the nuclear pore complex
Benjamin L Timney et al. J Cell Biol. 2016.
Abstract
Passive macromolecular diffusion through nuclear pore complexes (NPCs) is thought to decrease dramatically beyond a 30-60-kD size threshold. Using thousands of independent time-resolved fluorescence microscopy measurements in vivo, we show that the NPC lacks such a firm size threshold; instead, it forms a soft barrier to passive diffusion that intensifies gradually with increasing molecular mass in both the wild-type and mutant strains with various subsets of phenylalanine-glycine (FG) domains and different levels of baseline passive permeability. Brownian dynamics simulations replicate these findings and indicate that the soft barrier results from the highly dynamic FG repeat domains and the diffusing macromolecules mutually constraining and competing for available volume in the interior of the NPC, setting up entropic repulsion forces. We found that FG domains with exceptionally high net charge and low hydropathy near the cytoplasmic end of the central channel contribute more strongly to obstruction of passive diffusion than to facilitated transport, revealing a compartmentalized functional arrangement within the NPC.
© 2016 Timney et al.
Figures
Figure 1.
Characterizing the passive permeability barrier of yeast NPCs. (A) Expected decay in passive permeability rates with molecular mass in a rigid versus soft barrier to passive transport. (B) Permeability of yeast NPCs determined in vivo using a FRAP approach. From left to right: At time t = 0 s, the cytoplasmic pool of reporter macromolecules is photobleached with a spot-bleaching laser (cyan crosshair), and the nuclear fluorescence in a single cell is plotted over time, as the nuclear pool of reporters equilibrates with the cytoplasm through passive diffusion. Bars, 1 µm. Note, at steady state, the cytoplasm can appear ∼20% less bright than the nucleus because of vesicles and other structures below imaging resolution that do not contain GFP. We have not adjusted for this small deviance from the ideal N/C of 1, as the effect is small and consistent between strains. The mean transport time τ is the time constant of the exponential decay in nuclear fluorescence; the nuclear volume, cytoplasmic volumes, and number of NPCs are then quantified based on 3D reconstruction of the cell, using a complete image series through the z axis acquired after the time course. These data are integrated to compute the permeability coefficient in a single cell. The population mean of several such measurements from many cells is computed from multiple independent measurements, where each dot in the violin plot indicates a permeability coefficient from a single cell. AU, arbitrary units.
Figure 2.
The relationship between molecular size (and shape) and in vivo diffusion of free proteins. (A) Passively diffusing reporter macromolecules used in this study, showing their molecular mass, in vitro diffusion constants (D) measured using DLS, and sedimentation coefficients (S) measured from sucrose gradient centrifugation. (B) Measured diffusion constant (D) in solution plotted against molecular mass and sedimentation coefficients (inset), ±SEM. (C) Images of representative single cell’s FRAP experiments (bottom) of six different-sized substrates in WT yeast cells. Bars, 1 µm. The nucleus, cytoplasm, and vacuole of the top cell is indicated. Nuclear fluorescence is plotted after normalizing each exponential fit between 2 (at t = 0) and 1 (at t = ∞; top). (D) Diffusion curves from all such measurements of WT cells for the different-sized reporters, normalized as in C. (E) Population distributions of permeability coefficients for the different reporters as a function of their size. Each dot indicates the computed permeability coefficient for a single cell.
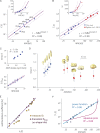
Figure 3.
Effect of molecular mass on the exponential time constant τ^**.** (A) τ^ Values plotted as a function of the substrate molecular masses in log-log or linear scale (inset), ±95% confidence intervals. The fit to a power function is shown in a solid bold line; the thin gray lines indicate the power function at the 95% confidence intervals of the fit. (B) τ^ Values as a function of the reporter molecular masses in log-log or linear scale (inset) for the joint set that includes our measurements as in A (blue) and the normalized τ^ values that we computed for larger cargos, based on the reported ratio between nuclear and cytoplasmic fluorescence after incubation (Popken et al., 2015; red). The fit to a power function is indicated as in A. (C, top) The ratio between Smax, the sedimentation coefficient of a perfect sphere, and S, the measured sedimentation coefficient, plotted against the SAXS measured shape asymmetry. (bottom) The ratio between the measured sedimentation coefficient and the measured diffusion coefficient ± 95% confidence intervals, plotted against molecular mass. According to the theory of sedimentation, S/D ∼ molecular mass (Erickson, 2009). (D) Smax/S ratios, which are correlated with shape asymmetry plotted for reporter molecules of different molecular masses for the joint dataset as in B and C ± 95% confidence intervals. Enclosing envelopes (yellow surface representation) computed from either SAXS measurements for each substrate in our dataset, or modeled based on the Smax/S values in the Popken et al. (2015) datasets, using the crystallographic models of each of their GFP, PrA, and MBP subunits (Materials and methods). (E) Theoretical Smax and measured S sedimentation coefficients plotted as a function of τ in log-log scale. The fits of Smax and S to a power function of τ are shown in solid magenta and orange lines, respectively. (F) Same as inset of B, with a best fit to a theoretical model of an aqueous pore (Renkin, 1954) shown in solid magenta line.
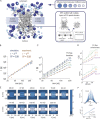
Figure 4.
Thermodynamics and kinetics analysis of simulated passive diffusion. (A) Coarse-grained model of the passive diffusion through the NPC, with the NPC modeled as a cylindrical scaffold, with flexible FG repeats anchored to its walls. (B) Simulated and experimental exponential time constants of transport ± 95% confidence intervals, plotted as a function of molecular mass, with solid lines showing fits to power functions. The absolute values of the simulated time constants are scaled by a single constant value, to allow direct comparison with the experimental data, but without affecting the slope or the relative magnitude of the data points in any way. (C) As in B for simulated NPCs depleted in FG chains from 100% (top) to 50% (bottom). (D, top) As in B and C for FG domains with increasing cohesiveness. The legend indicates the interaction force k between pairs of FG motifs in units of kT/Å over a range of 6 Å. Results did not change significantly for k values in the range 0.0–1.7 kT/Å. (bottom) Energy for the same molecules and cohesiveness level as in the top panel; see also F. (E) The free energy barrier for diffusing macromolecules of different molecular masses in units of kT (color bar), along a cross section of the NPC going parallel to the NE through the NPC central axis (x axis) and from the nucleus to the cytoplasm (Z axis). (F) The free energy barrier projected along the z axis, by integrating over a tube of radius 12 nm about the NPC central axis. The top panel shows the free energy barrier as a function of Z for each substrate; the bottom panel shows the magnitude of the barrier as a function of molecular mass ± 95% confidence intervals.
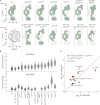
Figure 5.
Permeability of mutant strains. (A) Combinatorially deleted strains used in this study; deleted nups in each strain are indicated by white circles. Bottom left illustrates that each diagram represents the right half of a cross section of a diagrammatic NPC, where R is the radial distance from the pore radial axis, and the z axis denotes vertical proximity to the cytoplasm (positive values) or the nucleus (negative values). These approximate FG nup positions are drawn according to the localization map for the FG nup C termini used in Table S2 of reference (Alber et al., 2007a). FG nup diameters are estimated for visualization purposes using Eq. 6 in reference (Marsh and Forman-Kay, 2010). (B) Measured NPC permeability coefficients (p) in different strains for GFP-2PrA (molecular mass 40.7 kD) and GFP-4PrA (53.6 kD). Each black dot is from one single-cell FRAP measurement. Red dots are the mean for the GFP-2PrA or GFP-4PrA substrate in that strain. Δ_nup170_ was measured as positive control for a previously published “leaky strain” (Shulga et al., 2000). (C) Permeability of GFP-2PrA versus GFP-4PrA in the different strains relative to the permeability of the WT strain (±SEM). Strains lacking Nup100 or Nup116 GLFG domains are marked red, the nup49ΔFGnup57ΔFG strain green, WT black, Δ_nup170_ gray, and all others blue.
Figure 6.
Size-dependent permeability in four FG deletion strains. (A) An example of NPC permeability assays from representative single cells expressing GFP-2PrA, from FG deletion and control strains. Bars, 1 µm. The permeability of Δnup170 was measured as positive control for a previously published leaky strain (Shulga et al., 2000). (B) Strains in which mean transport times (τ^) were calculated for all six different-sized substrates are plotted ± 95% confidence intervals as a function of the reporter molecular masses in log-log scale, these being 29 (GFP), 34 (GFP-1PrA), 41 (GFP-2PrA), 47 (GFP-3PrA), 54 (GFP-4PrA), and 67 kD (GFP-6PrA). As GFP-xPrG data were only collected for WT cells, only GFP-xPrA data are included in this figure, for more direct comparisons. The solid line in each subplot indicates the fit to a power function. For the mutant strains, the WT fit is superimposed as a red line. The functional form of each power function is indicated along with the 95% confidence intervals for the power exponent.
Figure 7.
No single factor is a good predictor of NPC permeability. (A) Effect of select features on pore basal permeability (p/pWT) relative to the WT strain. Shown are the four features with the highest absolute correlation. Plots for all 33 features are shown in Fig. S5. (B) Predicted basal permeability (p/pWT) of combinatorial deletion strains (±SEM) relative to the WT strain according to the LASSO statistical regression model versus the experimental measurements for each strain. (C) Aggregate contribution of features related to either the ratio of net charge to hydropathy or position to the LASSO regression model. (D) p/pWT of individual nups relative to the WT strain according to the regression model. The nups are positioned based on their proximity to the cytoplasm (z axis) and their distance from the NPC radial axis, as observed in immuno-EM maps (Alber et al., 2007b). The prediction for Nup159 should be assigned lower confidence because of the unusual negative charge and architecture of Nup159.
Similar articles
- Nucleoporin's Like Charge Regions Are Major Regulators of FG Coverage and Dynamics Inside the Nuclear Pore Complex.
Peyro M, Soheilypour M, Ghavami A, Mofrad MR. Peyro M, et al. PLoS One. 2015 Dec 11;10(12):e0143745. doi: 10.1371/journal.pone.0143745. eCollection 2015. PLoS One. 2015. PMID: 26658558 Free PMC article. - Natively unfolded nucleoporins gate protein diffusion across the nuclear pore complex.
Patel SS, Belmont BJ, Sante JM, Rexach MF. Patel SS, et al. Cell. 2007 Apr 6;129(1):83-96. doi: 10.1016/j.cell.2007.01.044. Cell. 2007. PMID: 17418788 - Nuclear mRNA export requires specific FG nucleoporins for translocation through the nuclear pore complex.
Terry LJ, Wente SR. Terry LJ, et al. J Cell Biol. 2007 Sep 24;178(7):1121-32. doi: 10.1083/jcb.200704174. Epub 2007 Sep 17. J Cell Biol. 2007. PMID: 17875746 Free PMC article. - The selective permeability barrier in the nuclear pore complex.
Li C, Goryaynov A, Yang W. Li C, et al. Nucleus. 2016 Sep 2;7(5):430-446. doi: 10.1080/19491034.2016.1238997. Epub 2016 Sep 27. Nucleus. 2016. PMID: 27673359 Free PMC article. Review. - Structural dynamics of the nuclear pore complex.
Sakiyama Y, Panatala R, Lim RYH. Sakiyama Y, et al. Semin Cell Dev Biol. 2017 Aug;68:27-33. doi: 10.1016/j.semcdb.2017.05.021. Epub 2017 Jun 1. Semin Cell Dev Biol. 2017. PMID: 28579449 Review.
Cited by
- Alphaherpesvirus Major Tegument Protein VP22: Its Precise Function in the Viral Life Cycle.
Wu L, Cheng A, Wang M, Jia R, Yang Q, Wu Y, Zhu D, Zhao X, Chen S, Liu M, Zhang S, Ou X, Mao S, Gao Q, Sun D, Wen X, Liu Y, Yu Y, Zhang L, Tian B, Pan L, Chen X. Wu L, et al. Front Microbiol. 2020 Aug 7;11:1908. doi: 10.3389/fmicb.2020.01908. eCollection 2020. Front Microbiol. 2020. PMID: 32849477 Free PMC article. Review. - Role of charge in enhanced nuclear transport and retention of graphene quantum dots.
Gorav G, Khedekar V, Varier GK, Nandakumar P. Gorav G, et al. Sci Rep. 2024 Aug 16;14(1):19044. doi: 10.1038/s41598-024-69809-2. Sci Rep. 2024. PMID: 39152185 Free PMC article. - Nuclear Transport Deficits in Tau-Related Neurodegenerative Diseases.
Diez L, Wegmann S. Diez L, et al. Front Neurol. 2020 Sep 25;11:1056. doi: 10.3389/fneur.2020.01056. eCollection 2020. Front Neurol. 2020. PMID: 33101165 Free PMC article. Review. - Differential Behaviours and Preferential Bindings of Influenza Nucleoproteins on Importins-α.
Donchet A, Vassal-Stermann E, Gérard FCA, Ruigrok RWH, Crépin T. Donchet A, et al. Viruses. 2020 Jul 30;12(8):834. doi: 10.3390/v12080834. Viruses. 2020. PMID: 32751671 Free PMC article. - A discontinuous Galerkin model for fluorescence loss in photobleaching of intracellular polyglutamine protein aggregates.
Hansen CV, Schroll HJ, Wüstner D. Hansen CV, et al. BMC Biophys. 2018 Nov 29;11:7. doi: 10.1186/s13628-018-0046-0. eCollection 2018. BMC Biophys. 2018. PMID: 30519460 Free PMC article.
References
MeSH terms
Substances
Grants and funding
- R01 GM083960/GM/NIGMS NIH HHS/United States
- R01 GM112108/GM/NIGMS NIH HHS/United States
- R37 GM051219/GM/NIGMS NIH HHS/United States
- P41 GM109824/GM/NIGMS NIH HHS/United States
- R01 GM071329/GM/NIGMS NIH HHS/United States
- U01 GM098256/GM/NIGMS NIH HHS/United States
LinkOut - more resources
Full Text Sources
Other Literature Sources


