Evaluation of the Microbial Diversity in Amyotrophic Lateral Sclerosis Using High-Throughput Sequencing - PubMed (original) (raw)
Evaluation of the Microbial Diversity in Amyotrophic Lateral Sclerosis Using High-Throughput Sequencing
Xin Fang et al. Front Microbiol. 2016.
Abstract
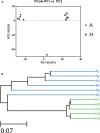
More and more evidences indicate that diseases of the central nervous system have been seriously affected by fecal microbes. However, little work is done to explore interaction between amyotrophic lateral sclerosis (ALS) and fecal microbes. In the present study, high-throughput sequencing method was used to compare the intestinal microbial diversity of healthy people and ALS patients. The principal coordinate analysis, Venn and unweighted pair-group method using arithmetic averages (UPGMA) showed an obvious microbial changes between healthy people (group H) and ALS patients (group A), and the average ratios of Bacteroides, Faecalibacterium, Anaerostipes, Prevotella, Escherichia, and Lachnospira at genus level between ALS patients and healthy people were 0.78, 2.18, 3.41, 0.35, 0.79, and 13.07. Furthermore, the decreased Firmicutes/Bacteroidetes ratio at phylum level using LEfSE (LDA > 4.0), together with the significant increased genus Dorea (harmful microorganisms) and significant reduced genus Oscillibacter, Anaerostipes, Lachnospiraceae (beneficial microorganisms) in ALS patients, indicated that the imbalance in intestinal microflora constitution had a strong association with the pathogenesis of ALS.
Keywords: amyotrophic lateral sclerosis (ALS); central nervous system (CNS); high-throughput sequencing; microbial diversity; principal coordinate analysis (PCoA).
Figures
FIGURE 1
Scalar–Venn representation of the microbiota between groups A and H. (A) Shared OUTs among samples H1, H2, H3, H4, and H5. (B) Shared OUTs among samples A1, A2, A3, A4, A5, and A6. (C) Shared OUTs between groups A and H.
FIGURE 2
The Principle component analysis (PCA) (A) and UPGMA Method of Beta diversity index (B) of groups A and H.
FIGURE 3
Composition and relative abundance of bacterial communities based 16S rDNA sequences in A and H groups. (A) Unsupervised hierarchical clustering analysis. (B) The relative abundances of the major bacteria in genus level.
FIGURE 4
Supervised comparison identifies differential abundance of bacteria using LEfSe (LDA > 4.0).
Similar articles
- Alterations in nasal microbiota of patients with amyotrophic lateral sclerosis.
Liu K, Guo Q, Ding Y, Luo L, Huang J, Zhang Q. Liu K, et al. Chin Med J (Engl). 2024 Jan 20;137(2):162-171. doi: 10.1097/CM9.0000000000002701. Epub 2023 Jul 21. Chin Med J (Engl). 2024. PMID: 37482646 Free PMC article. - The alteration of gut microbiome and metabolism in amyotrophic lateral sclerosis patients.
Zeng Q, Shen J, Chen K, Zhou J, Liao Q, Lu K, Yuan J, Bi F. Zeng Q, et al. Sci Rep. 2020 Aug 3;10(1):12998. doi: 10.1038/s41598-020-69845-8. Sci Rep. 2020. PMID: 32747678 Free PMC article. - Intestinal microbiota composition in patients with amyotrophic lateral sclerosis: establishment of bacterial and archaeal communities analyses.
Zhai CD, Zheng JJ, An BC, Huang HF, Tan ZC. Zhai CD, et al. Chin Med J (Engl). 2019 Aug 5;132(15):1815-1822. doi: 10.1097/CM9.0000000000000351. Chin Med J (Engl). 2019. PMID: 31306225 Free PMC article. - Riluzole for amyotrophic lateral sclerosis (ALS)/motor neuron disease (MND).
Miller RG, Mitchell JD, Lyon M, Moore DH. Miller RG, et al. Amyotroph Lateral Scler Other Motor Neuron Disord. 2003 Sep;4(3):191-206. Amyotroph Lateral Scler Other Motor Neuron Disord. 2003. PMID: 13129806 Review. - Therapeutic exercise for people with amyotrophic lateral sclerosis or motor neuron disease.
Dalbello-Haas V, Florence JM, Krivickas LS. Dalbello-Haas V, et al. Cochrane Database Syst Rev. 2008 Apr 16;(2):CD005229. doi: 10.1002/14651858.CD005229.pub2. Cochrane Database Syst Rev. 2008. PMID: 18425913 Updated. Review.
Cited by
- The Microbiota-Gut-Brain Axis and Neurological Disorders: A Comprehensive Review.
Nakhal MM, Yassin LK, Alyaqoubi R, Saeed S, Alderei A, Alhammadi A, Alshehhi M, Almehairbi A, Al Houqani S, BaniYas S, Qanadilo H, Ali BR, Shehab S, Statsenko Y, Meribout S, Sadek B, Akour A, Hamad MIK. Nakhal MM, et al. Life (Basel). 2024 Sep 26;14(10):1234. doi: 10.3390/life14101234. Life (Basel). 2024. PMID: 39459534 Free PMC article. Review. - Examining the complex Interplay between gut microbiota abundance and short-chain fatty acid production in amyotrophic lateral sclerosis patients shortly after onset of disease.
Fontdevila L, Povedano M, Domínguez R, Boada J, Serrano JC, Pamplona R, Ayala V, Portero-Otín M. Fontdevila L, et al. Sci Rep. 2024 Oct 8;14(1):23497. doi: 10.1038/s41598-024-75083-z. Sci Rep. 2024. PMID: 39379597 Free PMC article. - Disrupted gut harmony in attention-deficit/hyperactivity disorder: Dysbiosis and decreased short-chain fatty acids.
Steckler R, Magzal F, Kokot M, Walkowiak J, Tamir S. Steckler R, et al. Brain Behav Immun Health. 2024 Jul 27;40:100829. doi: 10.1016/j.bbih.2024.100829. eCollection 2024 Oct. Brain Behav Immun Health. 2024. PMID: 39184374 Free PMC article. - Is gut microbiota of patients with ALS different from that of healthy individuals?
Özaydin Aksun Z, Erdoğan S, Kalkanci A, Şahin EA, Çuhadar T, Şener HÖ. Özaydin Aksun Z, et al. Turk J Med Sci. 2024 May 7;54(3):579-587. doi: 10.55730/1300-0144.5825. eCollection 2024. Turk J Med Sci. 2024. PMID: 39050003 Free PMC article. - Gut microbiota and serum metabolomic alterations in modulating the impact of fecal microbiota transplantation on ciprofloxacin-induced seizure susceptibility.
Zou S, Li Y, Zou Q, Yang M, Li H, Niu R, Lai H, Wang J, Yang X, Zhou L. Zou S, et al. Front Microbiol. 2024 Jun 19;15:1403892. doi: 10.3389/fmicb.2024.1403892. eCollection 2024. Front Microbiol. 2024. PMID: 38962126 Free PMC article.
References
- Brooks B. R., Miller R. G., Swash M., Munsat T. L. (2000). El Escorial revisited: revised criteria for the diagnosis of amyotrophic lateral sclerosis. Amyotroph. Lateral. Scler. Other Motor Neuron Disord. 1 293–299. - PubMed
LinkOut - more resources
Full Text Sources
Other Literature Sources
Miscellaneous


