Patterns of Immune Infiltration in Breast Cancer and Their Clinical Implications: A Gene-Expression-Based Retrospective Study - PubMed (original) (raw)
Patterns of Immune Infiltration in Breast Cancer and Their Clinical Implications: A Gene-Expression-Based Retrospective Study
H Raza Ali et al. PLoS Med. 2016.
Abstract
Background: Immune infiltration of breast tumours is associated with clinical outcome. However, past work has not accounted for the diversity of functionally distinct cell types that make up the immune response. The aim of this study was to determine whether differences in the cellular composition of the immune infiltrate in breast tumours influence survival and treatment response, and whether these effects differ by molecular subtype.
Methods and findings: We applied an established computational approach (CIBERSORT) to bulk gene expression profiles of almost 11,000 tumours to infer the proportions of 22 subsets of immune cells. We investigated associations between each cell type and survival and response to chemotherapy, modelling cellular proportions as quartiles. We found that tumours with little or no immune infiltration were associated with different survival patterns according to oestrogen receptor (ER) status. In ER-negative disease, tumours lacking immune infiltration were associated with the poorest prognosis, whereas in ER-positive disease, they were associated with intermediate prognosis. Of the cell subsets investigated, T regulatory cells and M0 and M2 macrophages emerged as the most strongly associated with poor outcome, regardless of ER status. Among ER-negative tumours, CD8+ T cells (hazard ratio [HR] = 0.89, 95% CI 0.80-0.98; p = 0.02) and activated memory T cells (HR 0.88, 95% CI 0.80-0.97; p = 0.01) were associated with favourable outcome. T follicular helper cells (odds ratio [OR] = 1.34, 95% CI 1.14-1.57; p < 0.001) and memory B cells (OR = 1.18, 95% CI 1.0-1.39; p = 0.04) were associated with pathological complete response to neoadjuvant chemotherapy in ER-negative disease, suggesting a role for humoral immunity in mediating response to cytotoxic therapy. Unsupervised clustering analysis using immune cell proportions revealed eight subgroups of tumours, largely defined by the balance between M0, M1, and M2 macrophages, with distinct survival patterns by ER status and associations with patient age at diagnosis. The main limitations of this study are the use of diverse platforms for measuring gene expression, including some not previously used with CIBERSORT, and the combined analysis of different forms of follow-up across studies.
Conclusions: Large differences in the cellular composition of the immune infiltrate in breast tumours appear to exist, and these differences are likely to be important determinants of both prognosis and response to treatment. In particular, macrophages emerge as a possible target for novel therapies. Detailed analysis of the cellular immune response in tumours has the potential to enhance clinical prediction and to identify candidates for immunotherapy.
Conflict of interest statement
The authors have declared that no competing interests exist.
Figures
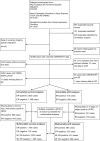
Fig 1. Study flowchart detailing the flow of samples at each stage of analysis.
*[15]. †[16]. ER, oestrogen receptor; pCR, pathological complete response; MI, multiple imputation; TGCA, The Cancer Genome Atlas.
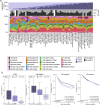
Fig 2. Summary of inferred immune cell subsets by study.
(A) Bar charts summarising immune cell subset proportions against ER status and CIBERSORT _p_-value by study. (B) Box plots depicting the association between immune cytolytic activity and CIBERSORT _p_-value (outliers are not shown; depicted chi-squared statistics and _p_-values are from Kruskal-Wallis tests); survival plots of groups defined by CIBERSORT _p_-value separately by ER status (depicted chi-squared statistics and _p_-values are from log-rank tests). *0.01 ≤ p < 0.05. a.u., arbitrary units; ER, oestrogen receptor; NK cells, natural killer cells; TGCA, The Cancer Genome Atlas.
Fig 3. Prognostic associations of subsets of immune cells.
(A) Unadjusted HRs (boxes) and 95% confidence intervals (horizontal lines) limited to cases with CIBERSORT _p_-value < 0.05. Box size is inversely proportional to the width of the confidence interval. Asterisks denote estimates with a _q_-value < 0.05. (B) Survival plots of quartiles of immune cell subsets. Depicted _p_-values are from log-rank tests. ER, oestrogen receptor; HR, hazard ratio; NK cells, natural killer cells.
Fig 4. Hazard ratios for three overlapping populations defined by CIBERSORT _p_-value.
Boxes represent hazard ratios, and vertical lines are 95% confidence intervals. Box size is inversely proportional to the width of the confidence interval. ER, oestrogen receptor; NK cells, natural killer cells.
Fig 5. Survival plots highlighting the patient subgroup with tumours containing little or no immune infiltration by CIBERSORT _p_-value.
Depicted _p_-values are from log-rank tests. ER, oestrogen receptor; T-regs, T regulatory cells.
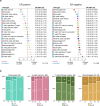
Fig 6. Association between immune cell subsets and response to neoadjuvant chemotherapy.
(A) Boxes represent ORs from unadjusted logistic regression models. Horizontal lines are 95% confidence intervals. Box size is inversely proportional to the width of the confidence interval. Asterisks denote estimates with _q_-value < 0.05. (B) Spine plots depicting the association between quartiles of immune cell subsets and pCR. ER, oestrogen receptor; NK cells, natural killer cells; OR, odds ratio; pCR, pathological complete response.
Fig 7. Hierarchical clustering of all samples based on immune cell proportions.
Stacked bar charts of samples ordered by cluster assignment. NK cells, natural killer cells.
Fig 8. Survival plots by cluster separately for ER-positive and ER-negative disease.
Depicted _p_-values are from log-rank tests. ER, oestrogen receptor.
Similar articles
- Tumour immune cell infiltration and survival after platinum-based chemotherapy in high-grade serous ovarian cancer subtypes: A gene expression-based computational study.
Liu R, Hu R, Zeng Y, Zhang W, Zhou HH. Liu R, et al. EBioMedicine. 2020 Jan;51:102602. doi: 10.1016/j.ebiom.2019.102602. Epub 2020 Jan 3. EBioMedicine. 2020. PMID: 31911269 Free PMC article. - Relevance of Tumor-Infiltrating Immune Cell Composition and Functionality for Disease Outcome in Breast Cancer.
Bense RD, Sotiriou C, Piccart-Gebhart MJ, Haanen JBAG, van Vugt MATM, de Vries EGE, Schröder CP, Fehrmann RSN. Bense RD, et al. J Natl Cancer Inst. 2016 Oct 13;109(1):djw192. doi: 10.1093/jnci/djw192. Print 2017 Jan. J Natl Cancer Inst. 2016. PMID: 27737921 Free PMC article. - Profiles of immune infiltration in colorectal cancer and their clinical significant: A gene expression-based study.
Xiong Y, Wang K, Zhou H, Peng L, You W, Fu Z. Xiong Y, et al. Cancer Med. 2018 Sep;7(9):4496-4508. doi: 10.1002/cam4.1745. Epub 2018 Aug 16. Cancer Med. 2018. PMID: 30117315 Free PMC article. - Capecitabine for hormone receptor-positive versus hormone receptor-negative breast cancer.
Hoon SN, Lau PK, White AM, Bulsara MK, Banks PD, Redfern AD. Hoon SN, et al. Cochrane Database Syst Rev. 2021 May 26;5(5):CD011220. doi: 10.1002/14651858.CD011220.pub2. Cochrane Database Syst Rev. 2021. PMID: 34037241 Free PMC article. - Clinical Implications of Breast Cancer Intrinsic Subtypes.
Rios-Hoyo A, Shan NL, Karn PL, Pusztai L. Rios-Hoyo A, et al. Adv Exp Med Biol. 2025;1464:435-448. doi: 10.1007/978-3-031-70875-6_21. Adv Exp Med Biol. 2025. PMID: 39821037 Review.
Cited by
- Evaluation of tumor immune contexture among intrinsic molecular subtypes helps to predict outcome in early breast cancer.
Klopfenstein Q, Derangère V, Arnould L, Thibaudin M, Limagne E, Ghiringhelli F, Truntzer C, Ladoire S. Klopfenstein Q, et al. J Immunother Cancer. 2021 Jun;9(6):e002036. doi: 10.1136/jitc-2020-002036. J Immunother Cancer. 2021. PMID: 34083415 Free PMC article. - RNA N6-Methyladenosine Regulator-Mediated Methylation Modifications Pattern and Immune Infiltration Features in Glioblastoma.
Pan Y, Xiao K, Li Y, Li Y, Liu Q. Pan Y, et al. Front Oncol. 2021 Feb 25;11:632934. doi: 10.3389/fonc.2021.632934. eCollection 2021. Front Oncol. 2021. PMID: 33718217 Free PMC article. - An integrative microenvironment approach for laryngeal carcinoma: the role of immune/methylation/autophagy signatures on disease clinical prognosis and single-cell genotypes.
Kang X, Chen Y, Yi B, Yan X, Jiang C, Chen B, Lu L, Sun Y, Shi R. Kang X, et al. J Cancer. 2021 May 13;12(14):4148-4171. doi: 10.7150/jca.58076. eCollection 2021. J Cancer. 2021. PMID: 34093817 Free PMC article. - Neutrophils: Orchestrators of the Malignant Phenotype.
Hsu BE, Shen Y, Siegel PM. Hsu BE, et al. Front Immunol. 2020 Aug 11;11:1778. doi: 10.3389/fimmu.2020.01778. eCollection 2020. Front Immunol. 2020. PMID: 32849639 Free PMC article. Review. - Transcriptomics-based characterization of the immuno-stromal microenvironment in pediatric low-grade glioma.
Körner M, Spohn M, Schüller U, Bockmayr M. Körner M, et al. Oncoimmunology. 2024 Aug 9;13(1):2386789. doi: 10.1080/2162402X.2024.2386789. eCollection 2024. Oncoimmunology. 2024. PMID: 39135890 Free PMC article.
References
MeSH terms
Grants and funding
- 19274/CRUK_/Cancer Research UK/United Kingdom
- 9675/CRUK_/Cancer Research UK/United Kingdom
- 10119/CRUK_/Cancer Research UK/United Kingdom
- 16942/CRUK_/Cancer Research UK/United Kingdom
- 16561/CRUK_/Cancer Research UK/United Kingdom
- 10124/CRUK_/Cancer Research UK/United Kingdom
- 16465/CRUK_/Cancer Research UK/United Kingdom
LinkOut - more resources
Full Text Sources
Other Literature Sources
Medical
Research Materials
Miscellaneous


