MUC1-C integrates PD-L1 induction with repression of immune effectors in non-small-cell lung cancer - PubMed (original) (raw)
. 2017 Jul 13;36(28):4037-4046.
doi: 10.1038/onc.2017.47. Epub 2017 Mar 13.
H Rajabi 1, C Jin 1, M Samur 1, A Tagde 1, M Alam 1, M Hiraki 1, T Maeda 1, X Hu 1, D Adeegbe 1, S Kharbanda 1, K-K Wong 1, D Kufe 1
Affiliations
- PMID: 28288138
- PMCID: PMC5509481
- DOI: 10.1038/onc.2017.47
MUC1-C integrates PD-L1 induction with repression of immune effectors in non-small-cell lung cancer
A Bouillez et al. Oncogene. 2017.
Abstract
Immunotherapeutic approaches, particularly programmed death 1/programmed death ligand 1 (PD-1/PD-L1) blockade, have improved the treatment of non-small-cell lung cancer (NSCLC), supporting the premise that evasion of immune destruction is of importance for NSCLC progression. However, the signals responsible for upregulation of PD-L1 in NSCLC cells and whether they are integrated with the regulation of other immune-related genes are not known. Mucin 1 (MUC1) is aberrantly overexpressed in NSCLC, activates the nuclear factor-κB (NF-κB) p65→︀ZEB1 pathway and confers a poor prognosis. The present studies demonstrate that MUC1-C activates PD-L1 expression in NSCLC cells. We show that MUC1-C increases NF-κB p65 occupancy on the CD274/PD-L1 promoter and thereby drives CD274 transcription. Moreover, we demonstrate that MUC1-C-induced activation of NF-κB→︀ZEB1 signaling represses the TLR9 (toll-like receptor 9), IFNG, MCP-1 (monocyte chemoattractant protein-1) and GM-CSF genes, and that this signature is associated with decreases in overall survival. In concert with these results, targeting MUC1-C in NSCLC tumors suppresses PD-L1 and induces these effectors of innate and adaptive immunity. These findings support a previously unrecognized central role for MUC1-C in integrating PD-L1 activation with suppression of immune effectors and poor clinical outcome.
Conflict of interest statement
CONFLICT OF INTEREST
The authors declare competing financial interests; D.K. holds equity in Genus Oncology and is a consultant to the company. The other authors disclosed no potential conflicts of interest.
Figures
Figure 1. MUC1-C drives PD-L1 expression in NSCLC cells
A–C. H1975 (A), H460 (B) and A549 (C) NSCLC cells stably expressing a Control shRNA (CshRNA) or a MUC1 shRNA (MUC1shRNA) were analyzed for PD-L1 mRNA levels by qRT-PCR (left). The results (mean±SEM of three biological replicates each performed in triplicate) are expressed as relative mRNA levels compared to that obtained with cells expressing CshRNA (assigned a value of 1). Lysates were immunoblotted with the indicated antibodies (right). D. A549 lung cancer cells were transfected to stably express an inducible control shRNA (left) or MUC1 shRNA (right). After treatment with doxycycline (DOX) for 72 h, lysates from the indicated cells were immunoblotted with antibodies against MUC1-C, PD-L1 and β-actin. E and F. H1975 (E) and H460 (F) cells were transiently transfected to express an empty vector or MUC1-C for 72 h. MUC1 (left) and PD-L1 (right) mRNA levels were determined by qRT-PCR. The results (mean±SEM of three biological replicates each performed in triplicate) are expressed as relative mRNA levels as compared to that obtained for cells expressing the empty vector (assigned a value of 1).
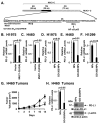
Figure 2. Targeting the MUC1-C cytoplasmic domain downregulates PD-L1 expression
A. Schematic representation of the MUC1-C subunit with the 58 aa extracellular domain (ED), the 28 aa transmembrane domain (TM), and the sequence of the 72 aa cytoplasmic domain (CD). The MUC1-C cytoplasmic domain contains a CQC motif that is necessary and sufficient for MUC1-C homodimerization and oncogenic function. GO-203 is a cell-penetrating peptide that targets the CQC motif and blocks MUC1-C homodimerization. GO-203 has been encapsulated into nanoparticles (GO-203/NPs) for delivery in mouse tumor models. The MUC1-C cytoplasmic domain binds directly to IKKβ, IKKγ and NF-κB p65 and promotes the activation of NF-κB target genes. B and C. H1975 (B) and H460 (C) cells were infected with lentiviral vectors to stably express an empty vector or MUC1-C(AQA). The indicated cells were analyzed for PD-L1 mRNA levels by qRT-PCR. The results (mean±SEM of three biological replicates each performed in triplicate) are expressed as relative PD-L1 mRNA levels as compared to that obtained for the vector cells (assigned a value of 1). D-F. H1975 (D), H460 (E) and H1299 (F) cells were treated with empty NPs or 2.5 μM GO-203/NPs for 0 and 72 h, and then harvested at 144 h. PD-L1 mRNA levels were determined by qRT-PCR. The results (mean±SEM of three biological replicates each performed in triplicate) are expressed as relative PD-L1 mRNA levels as compared to that obtained for the empty NP-treated cells (assigned a value of 1). G. Mice bearing established H460 tumor xenografts (~150 mm3) were treated weekly with intraperitoneal injections of empty NPs (squares) or 15 mg/kg GO-203/NPs (circles). The results are expressed as tumor volume (mean±SEM, 6 mice per group). * denotes p<0.05. ** denotes p<0.01. H. Tumors obtained on day 14 were analyzed for PD-L1 mRNA levels by qRT-PCR (left). The results (mean±SEM of three biological replicates each performed in triplicate) are expressed as relative PD-L1 mRNA levels as compared to that obtained for the tumors obtained in control mice (assigned a value of 1). Tumor lysates from empty NP- and GO-203/NP-treated mice (day 14) were immunoblotted with the indicated antibodies (right).
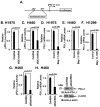
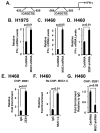
Figure 3. MUC1-C drives CD274/PD-L1 transcription by an NF-κB p65-dependent mechanism
A. Schema of the pPD-L1-Luc reporter with positioning of the putative the NF-κB binding site at −377 to −387 upstream to the transcription start site. B and C. The indicated H1975 (B) and H460 (C) cells were transfected with the pPD-L1-Luc reporter for 48 h and then assayed for luciferase activity. The results are expressed as the relative luciferase activity (mean±SEM of three biological replicates each performed in triplicate) compared with that obtained from cells expressing the CshRNA (assigned a value of 1). D–F. H1975 (D), H460 (E) and H1299 (F) cells were treated with 5 μM Bay-11-7085 or DMSO as the vehicle control for 18 h. PD-L1 mRNA levels were determined by qRT-PCR. The results (mean±SEM of three biological replicates each performed in triplicate) are expressed as relative PD-L1 mRNA levels as compared to that obtained for the control cells (assigned a value of 1). G. H460 cells stably expressing a CshRNA or an NF-κB p65 shRNA (NF-κBshRNA) were transfected with the pPD-L1-Luc reporter for 48 h and then assayed for luciferase activity. The results are expressed as the relative luciferase activity (mean±SEM of three biological replicates each performed in triplicate) compared with that obtained from cells expressing the CshRNA (assigned a value of 1). H. The indicated H460 cells were analyzed for PD-L1 mRNA levels by qRT-PCR (left). The results (mean±SEM of three biological replicates each performed in triplicate) are expressed as relative PD-L1 mRNA levels as compared to that obtained for cells expressing the CshRNA (assigned a value of 1). Lysates were immunoblotted with the indicated antibodies (right).
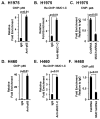
Figure 4. MUC1-C/NF-κB p65 complexes occupy the CD274/PD-L1 promoter
A. Soluble chromatin from H1975 cells was precipitated with anti-NF-κB or a control IgG. B. In the re-ChIP experiments, NF-κB precipitates were released and then reimmunoprecipitated with an anti-MUC1-C. The final DNA samples were amplified by qPCR with primers for the _CD274_promoter NF-κB binding region or GAPDH as a control. The results (mean±SEM of three biological replicates each performed in triplicate) are expressed as the relative fold enrichment compared to that obtained with the IgG control (assigned a value of 1). C. Soluble chromatin from H1975/CshRNA and H1975/MUC1shRNA cells was precipitated with anti-NF-κB or a control IgG. The final DNA samples were amplified by qPCR with primers for the PD-L1 promoter NF-κB binding region or GAPDH as a control. The results (mean±SEM of three biological replicates each performed in triplicate) are expressed as the relative fold enrichment compared to that obtained for H1975/CshRNA cell chromatin (assigned a value of 1). D. Soluble chromatin from H460 cells was precipitated with anti-NF-κB or a control IgG. E. In re-ChIP experiments, NF-κB precipitates were released and then reimmunoprecipitated with an anti-MUC1-C. The final DNA samples were amplified by qPCR with primers for the PD-L1 promoter NF-κB binding region or as a control GAPDH. The results (mean±SEM of three biological replicates each performed in triplicate) are expressed as the relative fold enrichment compared with that obtained with the IgG control (assigned a value of 1). F. Soluble chromatin from H460/CshRNA and H460/MUC1shRNA cells was precipitated with anti-NF-κB or a control IgG. The final DNA samples were amplified by qPCR with primers for the PD-L1 promoter NF-κB binding region or GAPDH as a control. The results (mean±SEM of three biological replicates each performed in triplicate) are expressed as the relative fold enrichment compared to that obtained for H460/CshRNA cell chromatin (assigned a value of 1).
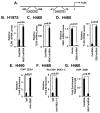
Figure 5. Targeting MUC1-C derepresses TLR9 expression
A. Schema of the TLR9 promoter with positioning of the E-boxes upstream to the transcription start site. B and C. The indicated H1975 (B) and H460 (C) cells were analyzed for TLR9 mRNA levels by qRT-PCR. The results (mean±SEM of three biological replicates each performed in triplicate) are expressed as relative mRNA levels as compared to that obtained for the CshRNA cells (assigned a value of 1). D. H460 cells stably express a control CshRNA or a ZEB1shRNA were analyzed for TLR9 mRNA levels by qRT-PCR. The results (mean±SEM of two biological replicates each performed in triplicate) are expressed as relative mRNA levels as compared to that obtained for the CshRNA cells (assigned a value of 1). E. Soluble chromatin from H460 cells was precipitated with anti-ZEB1 or a control IgG. F. In re-ChIP experiments, ZEB1 precipitates were released and then reimmunoprecipitated with anti-MUC1-C. The final DNA samples were amplified by qPCR with primers for the TLR9 promoter ZEB1 binding region or as a control GAPDH. The results (mean±SEM of two biological replicates each performed in triplicate) are expressed as the relative fold enrichment compared to that obtained with the IgG control (assigned a value of 1). G. Soluble chromatin from H460/CshRNA and H460/MUC1shRNA cells was precipitated with anti-ZEB1 or a control IgG. The final DNA samples were amplified by qPCR with primers for the TLR9 promoter ZEB1 binding region or as a control GAPDH. The results (mean±SEM of two biological replicates each performed in triplicate) are expressed as the relative fold enrichment compared to that obtained with H460/CshRNA cell chromatin (assigned a value of 1).
Figure 6. Targeting MUC1-C activates IFN-γ expression
A. Schema of the IFNG promoter with positioning of the E-boxes upstream to the transcription start site. B and C. The indicated H1975 (B) and H460 (C) cells were analyzed for IFN-γ mRNA levels by qRT-PCR. The results (mean±SEM of three biological replicates each performed in triplicate) are expressed as relative mRNA levels as compared to that obtained for the CshRNA cells (assigned a value of 1). D. H460 cells stably express a control CshRNA or a ZEB1shRNA were analyzed for IFN-γ mRNA levels by qRT-PCR. The results (mean±SEM of three biological replicates each performed in triplicate) are expressed as relative mRNA levels as compared to that obtained for the CshRNA cells (assigned a value of 1). E. Soluble chromatin from H460 cells was precipitated with anti-ZEB1 or a control IgG. F. In the re-ChIP experiments, ZEB1 precipitates were released and then reimmunoprecipitated with anti-MUC1-C. The final DNA samples were amplified by qPCR with primers for the IFNG promoter ZEB1 binding region or as a control GAPDH. The results (mean±SEM of three biological replicates each performed in triplicate) are expressed as the relative fold enrichment compared to that obtained with the IgG control (assigned a value of 1). G. Soluble chromatin from H460/CshRNA (left) and H460/MUC1shRNA was precipitated with anti-ZEB1 or a control IgG (right). The final DNA samples were amplified by qPCR with primers for the IFNG promoter ZEB1 binding region or as a control GAPDH. The results (mean±SD of three biological replicates each performed in triplicate) are expressed as the relative fold enrichment compared to that obtained with the CshRNA cells.
Figure 7. Targeting MUC1-C induces MCP-1 and GM-CSF expression by ZEB1-mediated mechanisms
A and B. The indicated H460 cells were analyzed for MCP-1 (A) and GM-CSF (B) mRNA levels by qRT-PCR. The results (mean±SEM of two biological replicates each performed in triplicate) are expressed as relative mRNA levels as compared to that obtained for the CshRNA cells (assigned a value of 1). C. H460 tumors obtained on day 14 (see Fig. 2F) of treatment with empty NPs (open bars) or GO-203/NPs (solid bars) were analyzed for TLR9, IFN-γ, MCP-1 and GM-CSF mRNA levels by qRT-PCR. The results (mean±SEM of three biological replicates each performed in triplicate) are expressed as relative mRNA levels as compared to that obtained for the tumors obtained in empty NP-treated mice (assigned a value of 1). ** denotes p value <0.05. D. Kaplan-Meier plot comparing the overall survival of patients with NSCLC in the GSE19188 dataset. Patients were stratified with the high (red) or low (blue) expression of TLR9, IFN-γ, MCP-1 and GM-CSF against the median average. The survival curves were compared using Log-rank (Mantel-Cox) test. HR: Hazard Ratio. E. Proposed schema of a MUC1-C-induced inflammatory pathway linking EMT (blue) and regulation of immune-related genes (red) in NSCLC cells. MUC1-C activates the inflammatory NF-κB p65 pathway – and thereby PD-L1 expression. MUC1-C also upregulates TLR7, which contributes to NF-κB p65 activation, survival and chemoresistance of NSCLC cells . MUC1-C forms a complex with NF-κB p65 and induces the activation of NF-κB target genes, including MUC1 itself, in an autoinductive circuit . MUC1-C also promotes occupancy of NF-κB p65 on the ZEB1 and CD274/PD-L1 promoters and contributes to activation of these genes. The upregulation of ZEB1 and the formation of MUC1-C/ZEB1 complexes suppresses miR-200c and thereby induces EMT . Of note, PD-L1 is also a target of miR-200 , invoking the possibility that the MUC1-C→NF-κB p65→ZEB1 pathway could increase PD-L1 expression by both transcriptional and post-transcriptional mechanisms. Our results further support a role for MUC1-C/ZEB1 complexes in suppression of TLR9, IFNG, MCP-1 and GM-CSF, linking these responses with EMT. Thus, targeting MUC1-C suppresses PD-L1 and induces TLR9, IFN-γ, MCP-1 and GM-CSF expression in NSCLC tumors, supporting the notion that MUC1-C is of importance for integrating the regulation of these genes.
Similar articles
- An increase in BAG-1 by PD-L1 confers resistance to tyrosine kinase inhibitor in non-small cell lung cancer via persistent activation of ERK signalling.
Lin PL, Wu TC, Wu DW, Wang L, Chen CY, Lee H. Lin PL, et al. Eur J Cancer. 2017 Nov;85:95-105. doi: 10.1016/j.ejca.2017.07.025. Epub 2017 Sep 9. Eur J Cancer. 2017. PMID: 28892778 - Evodiamine suppresses non-small cell lung cancer by elevating CD8+ T cells and downregulating the MUC1-C/PD-L1 axis.
Jiang ZB, Huang JM, Xie YJ, Zhang YZ, Chang C, Lai HL, Wang W, Yao XJ, Fan XX, Wu QB, Xie C, Wang MF, Leung EL. Jiang ZB, et al. J Exp Clin Cancer Res. 2020 Nov 19;39(1):249. doi: 10.1186/s13046-020-01741-5. J Exp Clin Cancer Res. 2020. PMID: 33208183 Free PMC article. - BIN1 reverses PD-L1-mediated immune escape by inactivating the c-MYC and EGFR/MAPK signaling pathways in non-small cell lung cancer.
Wang J, Jia Y, Zhao S, Zhang X, Wang X, Han X, Wang Y, Ma M, Shi J, Liu L. Wang J, et al. Oncogene. 2017 Nov 9;36(45):6235-6243. doi: 10.1038/onc.2017.217. Epub 2017 Jul 17. Oncogene. 2017. PMID: 28714960 - Programmed Death-Ligand 1 Immunohistochemistry Testing: A Review of Analytical Assays and Clinical Implementation in Non-Small-Cell Lung Cancer.
Büttner R, Gosney JR, Skov BG, Adam J, Motoi N, Bloom KJ, Dietel M, Longshore JW, López-Ríos F, Penault-Llorca F, Viale G, Wotherspoon AC, Kerr KM, Tsao MS. Büttner R, et al. J Clin Oncol. 2017 Dec 1;35(34):3867-3876. doi: 10.1200/JCO.2017.74.7642. Epub 2017 Oct 20. J Clin Oncol. 2017. PMID: 29053400 Review. - [Advances of the Role of Lung Cancer Driver Gene and PD-1/PD-L1 Pathway Interaction in the Tumorigenesis and Progression of Non-small Cell Lung Cancer].
Shi Y, Lv W, Wang L, Hu J. Shi Y, et al. Zhongguo Fei Ai Za Zhi. 2017 Nov 20;20(11):781-786. doi: 10.3779/j.issn.1009-3419.2017.11.10. Zhongguo Fei Ai Za Zhi. 2017. PMID: 29167009 Free PMC article. Review. Chinese.
Cited by
- Monocyte subsets in breast cancer patients under treatment with aromatase inhibitor and mucin-1 cancer vaccine.
Knöbl V, Maier L, Grasl S, Kratzer C, Winkler F, Eder V, Hayden H, Sahagun Cortez MA, Sachet M, Oehler R, Frantal S, Fesl C, Zehetner K, Pfeiler G, Bartsch R, Fitzal F, Singer CF, Filipits M, Gnant M, Brostjan C. Knöbl V, et al. J Transl Med. 2024 Oct 8;22(1):913. doi: 10.1186/s12967-024-05659-w. J Transl Med. 2024. PMID: 39380101 Free PMC article. - Resistance to Cell Death in Mucinous Colorectal Cancer-A Review.
O'Connell E, Reynolds IS, McNamara DA, Burke JP, Prehn JHM. O'Connell E, et al. Cancers (Basel). 2021 Mar 19;13(6):1389. doi: 10.3390/cancers13061389. Cancers (Basel). 2021. PMID: 33808549 Free PMC article. Review. - MUC1 and MUC16: critical for immune modulation in cancer therapeutics.
Chen X, Sandrine IK, Yang M, Tu J, Yuan X. Chen X, et al. Front Immunol. 2024 Feb 1;15:1356913. doi: 10.3389/fimmu.2024.1356913. eCollection 2024. Front Immunol. 2024. PMID: 38361923 Free PMC article. Review. - Transcriptomic Correlates of Tumor Cell PD-L1 Expression and Response to Nivolumab Monotherapy in Metastatic Clear Cell Renal Cell Carcinoma.
Denize T, Hou Y, Pignon JC, Walton E, West DJ, Freeman GJ, Braun DA, Wu CJ, Gupta S, Motzer RJ, Atkins MB, McDermott D, Choueiri TK, Shukla SA, Signoretti S. Denize T, et al. Clin Cancer Res. 2022 Sep 15;28(18):4045-4055. doi: 10.1158/1078-0432.CCR-22-0923. Clin Cancer Res. 2022. PMID: 35802667 Free PMC article. Clinical Trial. - A novel bifunctional anti-PD-L1/TGF-β Trap fusion protein (M7824) efficiently reverts mesenchymalization of human lung cancer cells.
David JM, Dominguez C, McCampbell KK, Gulley JL, Schlom J, Palena C. David JM, et al. Oncoimmunology. 2017 Jul 13;6(10):e1349589. doi: 10.1080/2162402X.2017.1349589. eCollection 2017. Oncoimmunology. 2017. PMID: 29123964 Free PMC article.
References
- Hanahan D, Weinberg RA. Hallmarks of cancer: the next generation. Cell. 2011;144:646–674. - PubMed
- Balkwill F, Charles KA, Mantovani A. Smoldering and polarized inflammation in the initiation and promotion of malignant disease. Cancer Cell. 2005;7:211–217. - PubMed
- Reck M, Paz-Ares L. Immunologic checkpoint blockade in lung cancer. Semin Oncol. 2015;42:402–417. - PubMed
Publication types
MeSH terms
Substances
LinkOut - more resources
Full Text Sources
Other Literature Sources
Medical
Research Materials
Miscellaneous

