Mutations in valosin-containing protein (VCP) decrease ADP/ATP translocation across the mitochondrial membrane and impair energy metabolism in human neurons - PubMed (original) (raw)
Mutations in valosin-containing protein (VCP) decrease ADP/ATP translocation across the mitochondrial membrane and impair energy metabolism in human neurons
Marthe H R Ludtmann et al. J Biol Chem. 2017.
Abstract
Mutations in the gene encoding valosin-containing protein (VCP) lead to multisystem proteinopathies including frontotemporal dementia. We have previously shown that patient-derived VCP mutant fibroblasts exhibit lower mitochondrial membrane potential, uncoupled respiration, and reduced ATP levels. This study addresses the underlying basis for mitochondrial uncoupling using VCP knockdown neuroblastoma cell lines, induced pluripotent stem cells (iPSCs), and iPSC-derived cortical neurons from patients with pathogenic mutations in VCP Using fluorescent live cell imaging and respiration analysis we demonstrate a VCP mutation/knockdown-induced dysregulation in the adenine nucleotide translocase, which results in a slower rate of ADP or ATP translocation across the mitochondrial membranes. This deregulation can explain the mitochondrial uncoupling and lower ATP levels in VCP mutation-bearing neurons via reduced ADP availability for ATP synthesis. This study provides evidence for a role of adenine nucleotide translocase in the mechanism underlying altered mitochondrial function in VCP-related degeneration, and this new insight may inform efforts to better understand and manage neurodegenerative disease and other proteinopathies.
Keywords: ADP; ANT; ATP; VCP; amyotrophic lateral sclerosis (ALS) (Lou Gehrig disease); induced pluripotent stem cell (iPS cell) (iPSC); mitochondria.
© 2017 by The American Society for Biochemistry and Molecular Biology, Inc.
Conflict of interest statement
The authors declare that they have no conflicts of interest with the contents of this article
Figures
Figure 1.
A, RCR is the ratio of state 3 respiration (ADP stimulated) to state 4 respiration (no ADP present), and is considered an indication of the degree of coupling of mitochondrial respiratory chain activity to oxidative phosphorylation. RCR of mitochondria in permeabilized SHY5Y control and VCP knockdown cells (KD#1, KD#2, KD#3) in the presence of vehicle control, uncoupling protein inhibitors (GDP; Genipin), or ANT inhibitors (CATR; BKA). B, SHY5Y SCR and KD cells were probed for VCP, ANT1, UCP2, and β-actin by Western blotting (cropped). C, quantification of _V_Basal/_V_oligomycin in permeabilized SHY5Y control and VCP knockdown cells as an alternative indicator of coupling of mitochondrial respiratory chain activity to oxidative phosphorylation. D, full-length representative Western blot analysis of whole cell lysates from stable SCR SH-SY5Y cells and stable VCP knockdown SH-SY5Y cells probing for mitochondrial complexes and β-actin. *, p < 0.05; **, p < 0.01; ***, p < 0.001.
Figure 2.
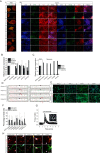
A, immunocytochemistry showing three control iPSCs and two patient-derived VCP mutant iPSCs lines (2 clones each). All stem cells show expression of pluripotency markers OCT4 and SSEA4 in stem cell conditions and have characteristic colony morphology. By day 80 of differentiation, β-III-tubulin positive neurons are formed expressing markers of deep (TBR1), middle (CTIP2), and upper (SATB2) cortical neurons. Size bar = 100 μm. B, qPCR analysis of four pluripotent stem cell markers in VCP patient-derived iPSCs and control fibroblasts, normalized to three housekeeping genes. C, qPCR analysis to represent faithful silencing of pluripotency genes in neuronal cultures, relative to hESC controls. D, DNA sequencing of iPSC-derived neuron genomic DNA showing mutated nucleotides corresponding to amino acid residues 155 and 191 (arrows). E, monolayer directed differentiation, showing the ability of newly derived iPSC lines to enter the endoderm and mesoderm differentiation pathways. Size bar = 50 μm. F, automated counting of mature neuronal markers displays no difference in the ability of control and VCP iPSCs to form deep (TBR1), middle (CTIP2), and upper (SATB2) layer cortical neurons. G, representative traces of Fura-2-loaded iPSC-derived neurons showing a transient cytosolic calcium response to physiological concentrations of glutamate. Representative image depicts iPSC-derived neurons loaded with Fura-2. H, iPSC-derived neurons express markers of glutamatergic neurons (vGLUT1) and functional synapses (PSD95). Size bar = 20 μm.
Figure 3.
Quantification of ANT1/2 gene expression in iPSC (A) and iPSC-derived neurons (B) by qPCR. Number of repeats are indicated in the bar chart. C, cropped Western blotting and D, densitometry analysis of VCP and ANT1/2 in iPSC-derived neurons. GAPDH was used as a loading control.
Figure 4.
A, i, transmission electron microscopy images of mitochondria within control and mutant iPSC-derived neurons at day 80 of differentiation. Mutant neurons consistently display a small proportion of swollen, electron dense mitochondria. Arrows show damaged cristae. Scale bar represent 1 μm. ii, quantification of swollen mitochondria. n = 3 control, n = 3 R155C and n = 1 R191Q. B, representative image of a neuron transfected with mitAT1.03 probe. C, representative traces of mitochondrial ATP after ADP application. Oligomycin was applied as a negative control. Scale bar represent 10 μm. D, quantification of the rate of ATP increase in control and VCP mutation bearing iPS cells. E, quantification of the rate of ATP increase in control and VCP iPS-derived neurons. *, p < 0.05; *, p < 0.05; ***, p < 0.001.
Figure 5.
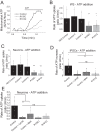
A, representative traces of mitochondrial ATP uptake. B, quantification of the rate of ATP uptake in control and VCP mutation bearing iPS cells. C, quantification of the rate of ATP uptake in control and VCP iPS-derived neurons. D, quantification of the rate of ATP uptake in control iPSCs or pre-exposed to ANT inhibitors (BKA/ATRAC) as well as mutation bearing iPSCs. E, quantification of the rate of ATP uptake in control neurons, neurons pre-exposed to ANT inhibitors (BKA/ATRAC), and mutations bearing neurons. *, p < 0.05; **, p < 0.01; ***, p < 0.001.
Similar articles
- In vitro studies in VCP-associated multisystem proteinopathy suggest altered mitochondrial bioenergetics.
Nalbandian A, Llewellyn KJ, Gomez A, Walker N, Su H, Dunnigan A, Chwa M, Vesa J, Kenney MC, Kimonis VE. Nalbandian A, et al. Mitochondrion. 2015 May;22:1-8. doi: 10.1016/j.mito.2015.02.004. Epub 2015 Feb 25. Mitochondrion. 2015. PMID: 25724235 Free PMC article. - Pathogenic VCP mutations induce mitochondrial uncoupling and reduced ATP levels.
Bartolome F, Wu HC, Burchell VS, Preza E, Wray S, Mahoney CJ, Fox NC, Calvo A, Canosa A, Moglia C, Mandrioli J, Chiò A, Orrell RW, Houlden H, Hardy J, Abramov AY, Plun-Favreau H. Bartolome F, et al. Neuron. 2013 Apr 10;78(1):57-64. doi: 10.1016/j.neuron.2013.02.028. Epub 2013 Mar 14. Neuron. 2013. PMID: 23498975 Free PMC article. - Pathogenic Mutations in the Valosin-containing Protein/p97(VCP) N-domain Inhibit the SUMOylation of VCP and Lead to Impaired Stress Response.
Wang T, Xu W, Qin M, Yang Y, Bao P, Shen F, Zhang Z, Xu J. Wang T, et al. J Biol Chem. 2016 Jul 1;291(27):14373-14384. doi: 10.1074/jbc.M116.729343. Epub 2016 May 13. J Biol Chem. 2016. PMID: 27226613 Free PMC article. - The transport mechanism of the mitochondrial ADP/ATP carrier.
Kunji ER, Aleksandrova A, King MS, Majd H, Ashton VL, Cerson E, Springett R, Kibalchenko M, Tavoulari S, Crichton PG, Ruprecht JJ. Kunji ER, et al. Biochim Biophys Acta. 2016 Oct;1863(10):2379-93. doi: 10.1016/j.bbamcr.2016.03.015. Epub 2016 Mar 19. Biochim Biophys Acta. 2016. PMID: 27001633 Review. - The ADP and ATP transport in mitochondria and its carrier.
Klingenberg M. Klingenberg M. Biochim Biophys Acta. 2008 Oct;1778(10):1978-2021. doi: 10.1016/j.bbamem.2008.04.011. Epub 2008 May 2. Biochim Biophys Acta. 2008. PMID: 18510943 Review.
Cited by
- P97/VCP ATPase inhibitors can rescue p97 mutation-linked motor neuron degeneration.
Wang F, Li S, Wang TY, Lopez GA, Antoshechkin I, Chou TF. Wang F, et al. Brain Commun. 2022 Jul 6;4(4):fcac176. doi: 10.1093/braincomms/fcac176. eCollection 2022. Brain Commun. 2022. PMID: 35865348 Free PMC article. - Emerging role of VCP/p97 in cardiovascular diseases: novel insights and therapeutic opportunities.
Shu H, Peng Y, Hang W, Zhou N, Wang DW. Shu H, et al. Biochem Soc Trans. 2021 Feb 26;49(1):485-494. doi: 10.1042/BST20200981. Biochem Soc Trans. 2021. PMID: 33439255 Free PMC article. Review. - The Overlapping Genetics of Amyotrophic Lateral Sclerosis and Frontotemporal Dementia.
Abramzon YA, Fratta P, Traynor BJ, Chia R. Abramzon YA, et al. Front Neurosci. 2020 Feb 5;14:42. doi: 10.3389/fnins.2020.00042. eCollection 2020. Front Neurosci. 2020. PMID: 32116499 Free PMC article. Review. - Amyloid β peptides are differentially vulnerable to preanalytical surface exposure, an effect incompletely mitigated by the use of ratios.
Toombs J, Foiani MS, Wellington H, Paterson RW, Arber C, Heslegrave A, Lunn MP, Schott JM, Wray S, Zetterberg H. Toombs J, et al. Alzheimers Dement (Amst). 2018 Mar 22;10:311-321. doi: 10.1016/j.dadm.2018.02.005. eCollection 2018. Alzheimers Dement (Amst). 2018. PMID: 29780875 Free PMC article. - Delineating Astrocytic Cytokine Responses in a Human Stem Cell Model of Neural Trauma.
Thelin EP, Hall CE, Tyzack GE, Frostell A, Giorgi-Coll S, Alam A, Carpenter KLH, Mitchell J, Tajsic T, Hutchinson PJ, Patani R, Helmy A. Thelin EP, et al. J Neurotrauma. 2020 Jan 1;37(1):93-105. doi: 10.1089/neu.2019.6480. Epub 2019 Sep 18. J Neurotrauma. 2020. PMID: 31452443 Free PMC article.
References
- Weihl C. C., Miller S. E., Hanson P. I., and Pestronk A. (2007) Transgenic expression of inclusion body myopathy associated mutant p97/VCP causes weakness and ubiquitinated protein inclusions in mice. Hum. Mol. Genet. 16, 919–928 - PubMed
- Nalbandian A., Llewellyn K. J., Badadani M., Yin H. Z., Nguyen C., Katheria V., Watts G., Mukherjee J., Vesa J., Caiozzo V., Mozaffar T., Weiss J. H., and Kimonis V. E. (2013) A progressive translational mouse model of human valosin-containing protein disease: the VCP(R155H/+) mouse. Muscle Nerve 47, 260–270 - PMC - PubMed
- Bartolome F., Wu H. C., Burchell V. S., Preza E., Wray S., Mahoney C. J., Fox N. C., Calvo A., Canosa A., Moglia C., Mandrioli J., Chiò A., Orrell R. W., Houlden H., Hardy J., Abramov A. Y., and Plun-Favreau H. (2013) Pathogenic VCP mutations induce mitochondrial uncoupling and reduced ATP levels. Neuron 78, 57–64 - PMC - PubMed
Publication types
MeSH terms
Substances
LinkOut - more resources
Full Text Sources
Other Literature Sources
Research Materials
Miscellaneous


