Compositionally distinct nuclear pore complexes of functionally distinct dimorphic nuclei in the ciliate Tetrahymena - PubMed (original) (raw)
. 2017 May 15;130(10):1822-1834.
doi: 10.1242/jcs.199398. Epub 2017 Apr 6.
Affiliations
- PMID: 28386019
- PMCID: PMC5450191
- DOI: 10.1242/jcs.199398
Compositionally distinct nuclear pore complexes of functionally distinct dimorphic nuclei in the ciliate Tetrahymena
Masaaki Iwamoto et al. J Cell Sci. 2017.
Abstract
The nuclear pore complex (NPC), a gateway for nucleocytoplasmic trafficking, is composed of ∼30 different proteins called nucleoporins. It remains unknown whether the NPCs within a species are homogeneous or vary depending on the cell type or physiological condition. Here, we present evidence for compositionally distinct NPCs that form within a single cell in a binucleated ciliate. In Tetrahymena thermophila, each cell contains both a transcriptionally active macronucleus (MAC) and a germline micronucleus (MIC). By combining in silico analysis, mass spectrometry analysis for immuno-isolated proteins and subcellular localization analysis of GFP-fused proteins, we identified numerous novel components of MAC and MIC NPCs. Core members of the Nup107-Nup160 scaffold complex were enriched in MIC NPCs. Strikingly, two paralogs of Nup214 and of Nup153 localized exclusively to either the MAC or MIC NPCs. Furthermore, the transmembrane components Pom121 and Pom82 localize exclusively to MAC and MIC NPCs, respectively. Our results argue that functional nuclear dimorphism in ciliates is likely to depend on the compositional and structural specificity of NPCs.
Keywords: FG-Nup; Nuclear dimorphism; Nuclear envelope; Nucleoporin; Y-complex.
© 2017. Published by The Company of Biologists Ltd.
Conflict of interest statement
Competing interestsThe authors declare no competing or financial interests.
Figures
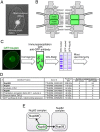
Fig. 1.
Immunoprecipitation and mass spectrometry analysis to identify Nup93 complex members. (A) A T. thermophila cell fixed with methanol and stained with DAPI to visualize the MAC and MIC. Scale bar: 20 μm. (B) The position of the Nup93 complex within the NPC architecture. See also
Fig. S1
. (C) Simplified procedure of immunoprecipitation and mass spectrometry for GFP–_Tt_Nup93-expressing cells used for immunoprecipitation. (D) Mass spectrometric identification of the proteins co-precipitated with GFP–_Tt_Nup93. The top seven proteins are listed among other identified proteins (further results are given in
Table S2
). (E) Physical interaction map of Nup93 based on the mass spectrometry results. MW, molecular mass.
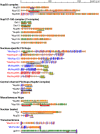
Fig. 2.
Distributions of secondary structures and conserved domains in Tetrahymena nucleoporins. Each Nup is shown as the protein name on the left. Blue, red and black letters denote MIC-specific, MAC-specific and shared components, respectively. Asterisks indicate Nups that are newly identified in this study. The colored components in the illustration are as follows: orange boxes/bars, α-helix; green boxes/bars, β-strand; red slanting lines, FG repeats; blue slanting lines, FX repeats (X means any residue, but the majority are N and Q); purple ellipses, predicted TM domain. Conserved domains are indicated by differently colored bars with standard domain names.
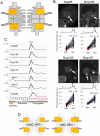
Fig. 3.
Y-complex components localize to both nuclei but are biased to MICs. (A) The position of the Y-complex (orange) within the NPC architecture. (B) Fluorescent micrographs of GFP-tagged Nups ectopically expressed in Tetrahymena cells. White broken lines represent the borders of cells. The inset in each panel shows a deconvoluted image focused on the MAC surface. Arrows indicate the position of the MIC. Scale bars: 20 μm. A line profile of fluorescence intensity along the thin green broken line is presented under each image panel. Blue and red arrowheads indicate the points corresponding to MIC and MAC envelopes, respectively. An asterisk marks the point at which the borders of the two nuclei overlap, and where the intensity is measured as the sum of both NEs. Below the line profile, the fluorescence intensities of MAC and MIC NEs from 50 cells are plotted. The vertical axis of the graph is shown in arbitrary units. Broken lines connect the plots of MAC and MIC within the same cell. Average values are presented by red and blue bars for the MAC and MIC, respectively. The numbers upon the MIC plots indicate fold increase (±s.d.) of fluorescence in MIC from MAC. All differences are significant (P<10−20 by Student's _t_-test). (C) Expression profiles of the Y-complex members extracted from the TetraFGD (
). Plots are the average of two values presented in the database. The horizontal axis represents successive stages of culture growth and therefore different physiological conditions. For the logarithmic growth stage, L-l, L-m, and L-h represent low, medium, and high cell concentrations, respectively. For starvation and conjugation stages, numbers represent hours after the transfer of the cells to each condition. The vertical axis represents relative values of mRNA expression. For details, visit the database website. (D) A simple representation of the deduced composition of MAC and MIC NPCs with different numbers of Y-complexes.
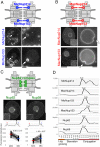
Fig. 4.
Newly identified FG-Nups of Tetrahymena. (A) MIC-specific paralogs of Nup214 and Nup153. The upper figure indicates the predicted positions of these Nups within the MIC NPC. Fluorescence micrographs show the subcellular localization of fluorescent protein-tagged Nups; MicNup214 and MicNup153 were endogenously tagged with GFP and mNeon at the C-termini of their ORFs, respectively. Arrows indicate the position of the MIC. Other fluorescent bodies dispersed in the cytoplasm are phagosomes taking in materials derived from the culture medium. (B) MAC-specific paralogs of Nup214 and Nup153. The upper figure indicates the predicted positions of these Nups within the MAC NPC. Fluorescence micrographs show the subcellular localizations of ectopically expressed GFP-tagged Nups. The left panels show a whole cell, and each nuclear region is enlarged in the right panels. White broken lines represent the borders of cells. Insets in the left panels show deconvoluted images focused on the MAC surface. Arrows indicate the position of MICs. (C) _Tt_Nup62 and _Tt_Nup58 localized to both nuclei. The upper illustration indicates the predicted position of these Nups, which are members of the Nup62 complex. Fluorescent micrographs show the subcellular localizations of ectopically expressed GFP–_Tt_Nup62 and _Tt_Nup58–GFP. Line profiles and plots of fluorescence intensity are shown under each image panel in the same manner as in Fig. 3B. Both differences are significant (P<10−16 by Student's _t_-test). (D) Expression profiles of FG-Nups, as in Fig. 3C. Scale bars: 20 μm (A,B, left panels; C); 5 μm (A,B, right panels).
Fig. 5.
Nuclear localization and expression profiles of Nup88, Nup185 and Tpr. (A) Expression profiles of Nup88, Nup185 and Tpr. (B) The predicted positions of _Tt_Nup88 and _Tt_Tpr in the NPC. The position of Nup185 is unknown. (C) The subcellular localization of ectopically expressed GFP–_Tt_Nup88. The fluorescence intensity of the MIC NE is significantly lower than that of the MAC NE (P<10−39). (D) Subcellular localization of ectopically expressed GFP–Nup185. The fluorescence intensity of the MIC NE is significantly lower than that of the MAC NE (P<10−30). (E) Subcellular localization of ectopically expressed GFP–_Tt_Tpr. The fluorescence intensity of the MIC NE is slightly lower than that of the MAC NE (_P_=0.0024). The left panels in C–E show a whole cell, and its nuclear region is enlarged in the right panels. White broken lines represent the borders of cells. The inset in the left panels show the deconvoluted image focused on the MAC surface. Arrows indicate the position of the MICs. A line profile and plots of fluorescence intensity are shown under each image panel, as in Fig. 3B. All _P_-values were calculated with a Student's _t_-test. Scale bars: 20 μm (C–E, left panels); 5 μm (C–E, right panels).
Fig. 6.
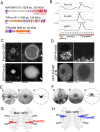
Two novel pore membrane proteins show nuclear specificity. (A) Illustration of molecular profiles. The frequency and positions of FG repeats are compared between T. thermophila Pom proteins and human POM121C (UniProt A8CG34). Red and blue slanting lines represent FG and FX (X means any amino acid residue, but the majority are N, Q and S) repeats, respectively. Orange and green boxes represent α-helices and β-strands, respectively. Purple ellipses represent predicted TM domains. (B) The expression profiles of nuclei-specific Pom proteins (MAC for Pom121 and MIC for Pom82) and shared _Tt_gp210, as in Fig. 3C. (C) Fluorescence micrographs of ectopically expressed GFP-tagged _Tt_Pom121. Left panels show whole cells, and the right panels show enlarged images of the nuclear regions. White broken lines represent the borders of cells. Arrows indicate the position of MICs. Bars indicate 20 μm for the left panels and 5 μm for the right panels. (D) Fluorescence micrographs as in C showing GFP-tagged Pom82 (full length, amino acids 1–699) and GFP–Pom82ΔTM (transmembrane domain-deletion mutant, amino acids 1–678), both ectopically expressed. Arrows indicate the position of the MICs. Other fluorescent bodies dispersed in the cytoplasm are phagosomes taking in materials derived from the culture medium. (E,F) iEM for Pom121–GFP localizing to the MAC NPC (E) and GFP–Pom82 localizing to the MIC NPC (F) as determined by using anti-GFP antibody. (a) Immuno-electron micrographs for a single NPC. Dark dots represent signals of gold particles. Scale bars: 100 nm. (b) Images present a projection image of 20 immuno-electron micrographs of NPCs decorated with gold particles. (c) The positions of individual gold particles in b are plotted. Broken lines trace nuclear envelope, and upper and lower sides are cytoplasm and nucleoplasm, respectively. (G) The position of _Tt_Pom121 within the MAC NPC architecture. (H) The position of _Tt_Pom82 within the MIC NPC architecture.
Fig. 7.
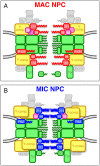
Schematic models of MAC and MIC NPCs. (A) Deduced composition of the MAC NPC. (B) Deduced composition of the MIC NPC. Boxes colored in red and blue represent MAC-specific and MIC-specific components, respectively [P121, Pom121; P82, Pom82; 98, Nup98 paralogs; 214, Nup214; 153, Nup153]. Green boxes represent shared components including the nuclear basket structure Tpr and its associated Nup50 (50). _Tt_Nup50 is distributed mostly in the nucleoplasm in MACs, whereas it localizes to the NPC in MICs (Malone et al., 2008; Iwamoto et al., 2009). Yellow boxes are MIC-biased Y-complexes, and purple boxes are MAC-biased _Tt_Nup88 (88). The number of duplications of yellow and purple boxes does not reflect the actual quantity of those components in vivo. Homologs of Nup358 (358), hCG1 (CG), Aladin (AL), and ELYS constituting the cytoplasmic structure, were not found in T. thermophila.
Similar articles
- Two distinct repeat sequences of Nup98 nucleoporins characterize dual nuclei in the binucleated ciliate tetrahymena.
Iwamoto M, Mori C, Kojidani T, Bunai F, Hori T, Fukagawa T, Hiraoka Y, Haraguchi T. Iwamoto M, et al. Curr Biol. 2009 May 26;19(10):843-7. doi: 10.1016/j.cub.2009.03.055. Epub 2009 Apr 16. Curr Biol. 2009. PMID: 19375312 - Biased assembly of the nuclear pore complex is required for somatic and germline nuclear differentiation in Tetrahymena.
Iwamoto M, Koujin T, Osakada H, Mori C, Kojidani T, Matsuda A, Asakawa H, Hiraoka Y, Haraguchi T. Iwamoto M, et al. J Cell Sci. 2015 May 1;128(9):1812-23. doi: 10.1242/jcs.167353. Epub 2015 Mar 18. J Cell Sci. 2015. PMID: 25788697 Free PMC article. - Nuclear localization signal targeting to macronucleus and micronucleus in binucleated ciliate Tetrahymena thermophila.
Iwamoto M, Mori C, Osakada H, Koujin T, Hiraoka Y, Haraguchi T. Iwamoto M, et al. Genes Cells. 2018 Jul;23(7):568-579. doi: 10.1111/gtc.12602. Epub 2018 Jun 8. Genes Cells. 2018. PMID: 29882620 - Structure and Assembly of the Nuclear Pore Complex.
Hampoelz B, Andres-Pons A, Kastritis P, Beck M. Hampoelz B, et al. Annu Rev Biophys. 2019 May 6;48:515-536. doi: 10.1146/annurev-biophys-052118-115308. Epub 2019 Apr 3. Annu Rev Biophys. 2019. PMID: 30943044 Review. - Dunking into the Lipid Bilayer: How Direct Membrane Binding of Nucleoporins Can Contribute to Nuclear Pore Complex Structure and Assembly.
Hamed M, Antonin W. Hamed M, et al. Cells. 2021 Dec 20;10(12):3601. doi: 10.3390/cells10123601. Cells. 2021. PMID: 34944108 Free PMC article. Review.
Cited by
- Nuclear Envelope Proteins Modulating the Heterochromatin Formation and Functions in Fission Yeast.
Hirano Y, Asakawa H, Sakuno T, Haraguchi T, Hiraoka Y. Hirano Y, et al. Cells. 2020 Aug 16;9(8):1908. doi: 10.3390/cells9081908. Cells. 2020. PMID: 32824370 Free PMC article. Review. - Exploration of the Nuclear Proteomes in the Ciliate Oxytricha trifallax.
Lu MW, Beh LY, Yerlici VT, Fang W, Kulej K, Garcia BA, Landweber LF. Lu MW, et al. Microorganisms. 2023 Jan 30;11(2):343. doi: 10.3390/microorganisms11020343. Microorganisms. 2023. PMID: 36838311 Free PMC article. - POM121 promotes the proliferation and metastasis of gastric cancer via PI3K/AKT/MYC pathway.
Kang C, Jia L, Hao L, Zhang N, Liu Y, Zhang L. Kang C, et al. Am J Cancer Res. 2023 Feb 15;13(2):485-497. eCollection 2023. Am J Cancer Res. 2023. PMID: 36895982 Free PMC article. - Asymmetrical localization of Nup107-160 subcomplex components within the nuclear pore complex in fission yeast.
Asakawa H, Kojidani T, Yang HJ, Ohtsuki C, Osakada H, Matsuda A, Iwamoto M, Chikashige Y, Nagao K, Obuse C, Hiraoka Y, Haraguchi T. Asakawa H, et al. PLoS Genet. 2019 Jun 6;15(6):e1008061. doi: 10.1371/journal.pgen.1008061. eCollection 2019 Jun. PLoS Genet. 2019. PMID: 31170156 Free PMC article. - Not just binary: embracing the complexity of nuclear division dynamics.
Walsh ME, King GA, Ünal E. Walsh ME, et al. Nucleus. 2024 Dec;15(1):2360601. doi: 10.1080/19491034.2024.2360601. Epub 2024 Jun 6. Nucleus. 2024. PMID: 38842147 Free PMC article. Review.
References
- Andersen K. R., Onischenko E., Tang J. H., Kumar P., Chen J. Z., Ulrich A., Liphardt J. T., Weis K. and Schwartz T. U. (2013). Scaffold nucleoporins Nup188 and Nup192 share structural and functional properties with nuclear transport receptors. Elife 2, e00745 10.7554/eLife.00745 - DOI - PMC - PubMed
- Asakawa H., Yang H.-J., Yamamoto T. G., Ohtsuki C., Chikashige Y., Sakata-Sogawa K., Tokunaga M., Iwamoto M., Hiraoka Y. and Haraguchi T. (2014). Characterization of nuclear pore complex components in fission yeast Schizosaccharomyces pombe. Nucleus 5, 149-162. 10.4161/nucl.28487 - DOI - PMC - PubMed
Publication types
MeSH terms
Substances
LinkOut - more resources
Full Text Sources
Other Literature Sources
Miscellaneous
