BORC coordinates encounter and fusion of lysosomes with autophagosomes - PubMed (original) (raw)
BORC coordinates encounter and fusion of lysosomes with autophagosomes
Rui Jia et al. Autophagy. 2017.
Abstract
Whereas the mechanisms involved in autophagosome formation have been extensively studied for the past 2 decades, those responsible for autophagosome-lysosome fusion have only recently begun to garner attention. In this study, we report that the multisubunit BORC complex, previously implicated in kinesin-dependent movement of lysosomes toward the cell periphery, is required for efficient autophagosome-lysosome fusion. Knockout (KO) of BORC subunits causes not only juxtanuclear clustering of lysosomes, but also increased levels of the autophagy protein LC3B-II and the receptor SQSTM1. Increases in LC3B-II occur without changes in basal MTORC1 activity and autophagy initiation. Instead, LC3B-II accumulation largely results from decreased lysosomal degradation. Further experiments show that BORC KO impairs both the encounter and fusion of autophagosomes with lysosomes. Reduced encounters result from an inability of lysosomes to move toward the peripheral cytoplasm, where many autophagosomes are formed. However, BORC KO also reduces the recruitment of the HOPS tethering complex to lysosomes and assembly of the STX17-VAMP8-SNAP29 trans-SNARE complex involved in autophagosome-lysosome fusion. Through these dual roles, BORC integrates the kinesin-dependent movement of lysosomes toward autophagosomes with HOPS-dependent autophagosome-lysosome fusion. These findings reveal a requirement for lysosome dispersal in autophagy that is independent of changes in MTORC1 signaling, and identify BORC as a novel regulator of autophagosome-lysosome fusion.
Keywords: BORC; HOPS; MTORC1; SNARE; autophagosomes; autophagy; fusion; kinesins; lysosomes; positioning.
Figures
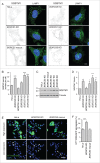
Figure 1.
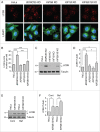
Increased LC3B-II levels in _BORC_-KO cells. (A) Schematic representation of BORC-ARL8-KIF1 and BORC-ARL8-PLEKHM2/SKIP-KLC-KIF5 machineries for centrifugal movement of lysosomes in non-neuronal cells., (B) Confocal microscopy of WT, _BORCS5_-KO, _BORCS5_-rescue, _BORCS6_-KO, _BORCS7_-KO, and _BORCS8_-KO cells immunostained for endogenous LC3B and LAMP1. Nuclei were stained with DAPI. Scale bar: 10 μm. (C) Quantification of LC3B puncta from experiments as in B. Bars represent the mean ± SEM of puncta per cell from 20 cells in 3 independent experiments. **P < 0.001, ***P < 0.0001, one-way ANOVA, followed by multiple comparisons using the Dunnett test. (D) Cell extracts of WT, _BORCS5_-KO, _BORCS5_-rescue, _BORCS6_-KO, _BORCS7_-KO, and _BORCS8_-KO cells were analyzed by immunoblotting with antibodies to the proteins indicated at right. The positions of molecular mass markers (in kDa) are indicated at left. (E) Quantification of LC3B-II levels (normalized to tubulin) from experiments as in E. Bars represent the mean ± SEM from 3 independent experiments. *P < 0.05, **P < 0.01, ***P < 0.0001, one-way ANOVA, followed by multiple comparisons using the Dunnett test.
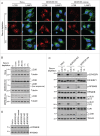
Figure 2.
Increased SQSTM1 levels and decreased aggregate clearance in _BORC_-KO cells. (A) Confocal micrographs of WT, _BORCS5_-KO, _BORCS5_-rescue, _BORCS6_-KO, _BORCS7_-KO, and _BORCS8_-KO cells immunostained for SQSTM1 and LAMP1. Images of SQSTM1 staining are in negative grayscale for easier visualization. Nuclei were stained with DAPI. Scale bar: 10 μm. (B) Quantification of SQSTM1 puncta from experiment in A. Bars represent the mean ± SEM of SQSTM1 puncta per cell from 30 cells. ***P < 0.0001, one-way ANOVA, followed by multiple comparisons using the Dunnett test. (C) Immunoblotting of extracts from WT, _BORCS5_-KO, _BORCS5_-rescue, _BORCS6_-KO, _BORCS7_-KO and _BORCS8_-KO cells with antibodies to SQSTM1 and tubulin (control). The positions of molecular mass markers (in kDa) are indicated at left. (D) Quantification of SQSTM1 normalized to tubulin from experiments as in (C). Bars represent the mean ± SEM from 3 independent experiments. *P < 0.05, **P < 0.001, ***P < 0.0001, one-way ANOVA, followed by multiple comparisons using the Dunnett test. (E) Confocal images of WT, _BORCS5_-KO and _BORCS5_-rescue cells transfected with a plasmid encoding the aggregation-prone HTT103Q-EGFP for 48 h. Arrowheads indicate intracellular aggregates of HTT103Q-EGFP. Nuclei were stained with DAPI. Scale bar: 50 μm. (F) Percentage of cells with EGFP-positive aggregates. Over 600 GFP-positive cells from 3 independent experiments were analyzed. Bars represent the mean ± SEM of the percentage of cells with EGFP-positive aggregates. ***P < 0.0001, one-way ANOVA, followed by multiple comparisons using the Dunnett test.
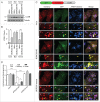
Figure 3.
Changes in lysosome positioning induced by serum depletion are dependent on BORC. (A) Confocal microscopy of WT, _BORCS5_-KO and _BORCS5_-rescue cells placed in serum-free DMEM for the indicated times, and immunostained for endogenous LC3B and LAMP1. Nuclei were stained with DAPI. Scale bar: 15 μm. (B) WT, _BORCS5_-KO and _BORCS5_-rescue cells were placed in serum-free DMEM and collected at the indicated times. Cell lysates were subjected to immunoblotting with antibodies to LC3B and tubulin (control). (C) WT, _BORCS5_-KO and _BORCS5_-rescue cells were placed in serum-free DMEM for the indicated times, and cell lysates were analyzed by immunoblotting with antibodies to the indicated proteins. (D) WT, _BORCS5_-KO, _BORCS5_-rescue, _BORCS6_-KO, _BORCS7_-KO, and _BORCS8_-KO cells were lysed for immunoblotting with antibodies to RPS6KB and p-RPS6KB. In (B to D), the positions of molecular mass markers (in kDa) are indicated at left.
Figure 4.
Reduced autophagic flux in _BORCS5_-KO cells. (A) WT and _BORCS5_-KO cells were treated with no additions, 50 nM bafilomycin A1 (Baf), or 400 nM Torin2 for 2 h. LC3B-II and tubulin (control) levels were determined by immunoblotting. The positions of molecular mass markers (in kDa) are indicated at left. (B) Quantification of LC3B-II levels normalized to tubulin. Bars represent the mean ± SEM from 3 independent experiments. **P < 0.001, ***P < 0.0001, one-way ANOVA, followed by multiple comparisons using the Tukey test. (C) WT, _BORCS5_-KO and _BORCS5_-rescue cells were transiently transfected with a plasmid encoding tandem GFP-mCherry-LC3B (tfLC3B). Lysosomes were labeled by internalization of Alexa Fluor 647-conjugated dextran (AF647-dextran) for 6 h, and chased overnight. mCherry, GFP and Alexa Fluor 647 (pseudocolored in blue) were visualized by confocal microscopy of live cells. Peripheral (box 1) and juxtanuclear (box 2) regions were magnified to show autophagosomes (yellow arrowheads), autolysosomes (magenta arrowheads) and lysosomes (blue arrowheads). Scale bar: 10 μm in low magnification, 1 μm in high magnification images. (D) The ratio of the number of autolysosomes (red-blue-positive puncta) to autophagosomes (red-green-positive puncta) was determined in the whole cell, the peripheral region and the juxtanuclear region. Bars represent the mean ± SEM of the ratio in 70 cells from 3 independent experiments. *P < 0.01, ***P < 0.0001, two-way ANOVA followed by multiple comparisons using the Tukey test.
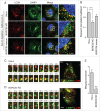
Figure 5.
Reduced autophagosome-lysosome encounters in _BORCS5_-KO cells. (A) Confocal microscopy of WT, _BORCS5_-KO and _BORCS5_-rescue cells placed in serum-free DMEM with 50 nM Baf for 30 min, and then immunostained with antibodies to LC3B and LAMP1. Nuclei were stained with DAPI. Scale bar: 10 μm. Images on the right column are magnifications of the boxed areas. Scale bar: 2.5 μm. (B) Pearson correlation coefficient of LC3B and LAMP1 colocalization from experiment in A. Bars represent the mean ± SEM of >80 cells from 3 independent experiments. ***P < 0.0001, one-way ANOVA, followed by multiple comparisons using the Dunnett test. (C, D) WT (C) and _BORCS5_-KO (D) cells transiently expressing LAMP1-GFP and mCherry-LC3B were analyzed by time-lapse microscopy in serum-free DMEM. Images in (C and D) start at 25 min and 40 min after serum depletion, respectively. Scale bar: 10 μm. The left panels show magnified time-lapse images of the LC3B (red) and LAMP1 (green) vesicles indicated by arrowheads in the whole cell shown on the right. (E) Quantification of the number of autophagosome-lysosome merging events in 1 h from the experiments described in (C and D). Bars represent the mean ± SEM in 10 cells from 3 independent experiments. ***P < 0.0001, the unpaired Student t test.
Figure 6.
Slight increase in LC3B-II levels in _KIF5B KIF1B_-double-KO cells. (A) Confocal microscopy of WT, _KIF5B_-KO, _KIF1B_-KO and KIF5B KIF1B-double-KO cells immunostained for endogenous LC3B and LAMP1. Nuclei were stained with DAPI. Scale bar: 15 μm. (B) Quantification of LC3B puncta. Bars represent the mean ± SEM of LC3B puncta per cell in 25 cells from 3 independent experiments. ***P < 0.0001, one-way ANOVA, followed by multiple comparisons using the Tukey test. (C) Cell extracts of WT, _KIF5B_-KO, _KIF1B_-KO and _KIF5B KIF1B_-double-KO cells were analyzed by immunoblotting with antibodies to LC3B and tubulin (control). The positions of molecular mass markers (in kDa) are indicated at left. (D) Quantification of LC3B-II normalized to tubulin levels. Bars represent the mean ± SEM LC3B-II/tubulin ratio from 3 independent experiments. *P < 0.01, ***P < 0.0001, one-way ANOVA, followed by multiple comparisons using the Tukey test. (E) WT and _KIF5B KIF1B_-double-KO cells were treated with no additions or 50 nM Baf for 2 h. LC3B-II and tubulin (control) levels were determined by immunoblotting. The positions of molecular mass markers (in kDa) are indicated at left. (F) Quantification of LC3B-II levels (normalized to tubulin) from experiments as in (E). Bars represent the mean ± SEM from 3 independent experiments. *P < 0.01, one-way ANOVA, followed by multiple comparisons using the Tukey test.
Figure 7.
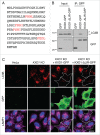
WT and ΔLIR-mutant KXD1 equally reduced LC3B accumulation in _KXD1_-KO cells. (A) Four potential LIR (LC3-interacting region) motifs in KXD1 are highlighted in red. LIR prediction was performed using an online database at
http://repeat.biol.ucy.ac.cy/iLIR/
. (B) Lysates of HeLa cells transfected with plasmids encoding GFP, GFP-tagged WT KXD1 or KXD1 with mutations in all 4 LIR motifs (ΔLIR) were immunoprecipitated with an antibody to GFP followed by immunoblotting with antibodies to GFP and LC3B. (C) WT, _KXD1_-KO cells, and _KXD1_-KO cells rescued with KXD1-GFP or KXD1(ΔLIR)-GFP were stained with antibody to LC3B. The outlines of the transfected cells are indicated. Nuclei were stained with DAPI. Cells were imaged by confocal microscopy. Scale bar: 20 μm.
Figure 8.
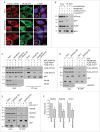
BORC promotes recruitment of HOPS to lysosomes and assembly of autophagic STX17 SNARE complex. (A) Confocal microscopy of WT, _BORCS5_-KO and _BORCS5_-rescue HeLa cells transiently transfected with plasmids encoding mCherry-VPS41 and ARL8B-GFP. Lysosomes were visualized by LAMP1 staining. Nuclei were stained with DAPI. Scale bar: 15 μm. (B) Lysates of HEK293T cells transfected with plasmids encoding mCherry-VPS41, FLAG-STX17 and either MYC-BORCS6, ARL8B-GFP or MYC-BORCS6+ARL8B-GFP were immunoprecipitated using antibody to the MYC epitope followed by immunoblotting with antibodies to the indicated proteins. (C) WT, _ARL8B_-KO and _ARL8B_-KO-ARL8A-KD HeLa cells were transfected with plasmids encoding FLAG-VPS41, FLAG-STX17 and MYC-BORCS6. Cells were lysed and immunoprecipitated with antibody to MYC and immunoblotted with antibodies to the indicated proteins. (D) WT and _BORCS5_-KO HeLa cells were transfected with plasmids encoding FLAG-VPS41, FLAG-STX17 and either GFP or ARL8B-GFP. Cells were lysed and immunoprecipitated with antibody to GFP and immunoblotted with antibodies to the indicated proteins. (E) WT and _BORCS5_-KO HeLa cells were transfected with plasmids encoding GFP or GFP-STX17. Cells were lysed and immunoprecipitated with antibody to GFP and immunoblotted for the indicated proteins. In (B to E), the positions of molecular mass markers (in kDa) are indicated at left. (F) Quantification of VAMP8, SNAP29 and VPS41 in immunoprecipitates (normalized to input) from experiments as in (E). Bars represent the mean ± SEM from 3 independent experiments. *P < 0.05, **P < 0.001, the unpaired Student t test.
Figure 9.
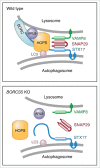
Schematic representation of the regulation of autophagosome-lysosome fusion by BORC. In WT cells, BORC recruits ARL8 and HOPS to the lysosomal membrane. HOPS in turn interacts with LC3B and STX17 on the autophagosomal membrane, promoting assembly of the STX17-VAMP8-SNAP29 _trans_-SNARE complex and autophagosome-lysosome fusion. In BORC-KO cells, ARL8B and HOPS remain in the cytosol, impairing STX17-VAMP8-SNAP29 _trans_-SNARE complex assembly and autophagosome-lysosome fusion.
Similar articles
- Non-canonical role of the SNARE protein Ykt6 in autophagosome-lysosome fusion.
Takáts S, Glatz G, Szenci G, Boda A, Horváth GV, Hegedűs K, Kovács AL, Juhász G. Takáts S, et al. PLoS Genet. 2018 Apr 25;14(4):e1007359. doi: 10.1371/journal.pgen.1007359. eCollection 2018 Apr. PLoS Genet. 2018. PMID: 29694367 Free PMC article. - Impairment of autophagosome-lysosome fusion in the buff mutant mice with the VPS33A(D251E) mutation.
Zhen Y, Li W. Zhen Y, et al. Autophagy. 2015;11(9):1608-22. doi: 10.1080/15548627.2015.1072669. Autophagy. 2015. PMID: 26259518 Free PMC article. - Toward an understanding of autophagosome-lysosome fusion: The unsuspected role of ATG14.
Bernard A, Klionsky DJ. Bernard A, et al. Autophagy. 2015 Apr 3;11(4):583-4. doi: 10.1080/15548627.2015.1029220. Autophagy. 2015. PMID: 25920502 Free PMC article. - New insights regarding SNARE proteins in autophagosome-lysosome fusion.
Tian X, Teng J, Chen J. Tian X, et al. Autophagy. 2021 Oct;17(10):2680-2688. doi: 10.1080/15548627.2020.1823124. Epub 2020 Sep 24. Autophagy. 2021. PMID: 32924745 Free PMC article. Review. - The multi-functional SNARE protein Ykt6 in autophagosomal fusion processes.
Kriegenburg F, Bas L, Gao J, Ungermann C, Kraft C. Kriegenburg F, et al. Cell Cycle. 2019 Mar-Apr;18(6-7):639-651. doi: 10.1080/15384101.2019.1580488. Epub 2019 Mar 17. Cell Cycle. 2019. PMID: 30836834 Free PMC article. Review.
Cited by
- Role of endolysosomes and inter-organellar signaling in brain disease.
Afghah Z, Chen X, Geiger JD. Afghah Z, et al. Neurobiol Dis. 2020 Feb;134:104670. doi: 10.1016/j.nbd.2019.104670. Epub 2019 Nov 9. Neurobiol Dis. 2020. PMID: 31707116 Free PMC article. Review. - Presynaptic Precursor Vesicles-Cargo, Biogenesis, and Kinesin-Based Transport across Species.
Petzoldt AG. Petzoldt AG. Cells. 2023 Sep 11;12(18):2248. doi: 10.3390/cells12182248. Cells. 2023. PMID: 37759474 Free PMC article. Review. - BORC-ARL8-HOPS ensemble is required for lysosomal cholesterol egress through NPC2.
Anderson J, Walker G, Pu J. Anderson J, et al. Mol Biol Cell. 2022 Aug 1;33(9):ar81. doi: 10.1091/mbc.E21-11-0595-T. Epub 2022 Jun 2. Mol Biol Cell. 2022. PMID: 35653304 Free PMC article. - Borcs6 is required for endo-lysosomal degradation during early development.
Bell CJ, Gupta N, Tremblay KD, Mager J. Bell CJ, et al. Mol Reprod Dev. 2022 Aug;89(8):337-350. doi: 10.1002/mrd.23626. Epub 2022 Jun 21. Mol Reprod Dev. 2022. PMID: 35726782 Free PMC article. - Dominant negative variants in KIF5B cause osteogenesis imperfecta via down regulation of mTOR signaling.
Marom R, Zhang B, Washington ME, Song IW, Burrage LC, Rossi VC, Berrier AS, Lindsey A, Lesinski J, Nonet ML, Chen J, Baldridge D, Silverman GA, Sutton VR, Rosenfeld JA, Tran AA, Hicks MJ, Murdock DR, Dai H, Weis M, Jhangiani SN, Muzny DM, Gibbs RA, Caswell R, Pottinger C, Cilliers D, Stals K; Undiagnosed Diseases Network; Eyre D, Krakow D, Schedl T, Pak SC, Lee BH. Marom R, et al. PLoS Genet. 2023 Nov 7;19(11):e1011005. doi: 10.1371/journal.pgen.1011005. eCollection 2023 Nov. PLoS Genet. 2023. PMID: 37934770 Free PMC article.
References
MeSH terms
Substances
LinkOut - more resources
Full Text Sources
Other Literature Sources
Research Materials
Miscellaneous

