Lipopolysaccharide-binding protein (LBP) reverses the amyloid state of fibrin seen in plasma of type 2 diabetics with cardiovascular co-morbidities - PubMed (original) (raw)
Lipopolysaccharide-binding protein (LBP) reverses the amyloid state of fibrin seen in plasma of type 2 diabetics with cardiovascular co-morbidities
Etheresia Pretorius et al. Sci Rep. 2017.
Abstract
Type 2 diabetes (T2D) has many cardiovascular complications, including a thrombotic propensity. Many such chronic, inflammatory diseases are accompanied (and may be exacerbated, and possibly even largely caused) by amyloid fibril formation. Recognising that there are few strong genetic associations underpinning T2D, but that amyloidogenesis of amylin is closely involved, we have been seeking to understand what might trigger the disease. Serum levels of bacterial lipopolysaccharide are raised in T2D, and we recently showed that fibrin(ogen) polymerisation during blood clotting can be affected strongly by LPS. The selectivity was indicated by the regularisation of clotting by lipopolysaccharide-binding protein (LBP). Since coagulopathies are a hallmark of T2D, we wondered whether they might too be caused by LPS (and reversed by LBP). We show here, using SEM and confocal microscopy, that platelet-poor-plasma from subjects with T2D had a much greater propensity for hypercoagulability and for amyloidogenesis, and that these could both be reversed by LBP. These data imply that coagulopathies are an important feature of T2D, and may be driven by 'hidden' LPS. Given the prevalence of amyloid formation in the sequelae of diabetes, this opens up novel strategies for both the prevention and treatment of T2D.
Conflict of interest statement
The authors declare that they have no competing interests.
Figures
Figure 1
Representative micrographs of PPP clots prepared from blood of two healthy individuals. (A and B) Micrographs were taken with a Zeiss LSM 510 META confocal microscope with a Plan-Apochromat 63x/1.4 Oil DIC objective. PPP was exposed to thioflavin T (ThT) (5 μM exposure concentration) followed by adding thrombin to create extensive fibrin clots.
Figure 2
(A and B) Low magnification micrographs of healthy PPP with added 0.2 ng.L−1 LPS Micrographs were taken with a Zeiss LSM 510 META confocal microscope with a Plan-Apochromat 63x/1.4 Oil DIC objective. All PPP was exposed to thioflavin T (ThT) (5 μM) followed by adding thrombin to create extensive fibrin clots. Areas of increased fluorescence are seen in the great majority of the clot area.
Figure 3
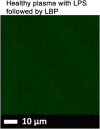
(A) A representative micrograph showing healthy PPP with added 0.2 ng.L−1 LPS (10 minutes exposure) followed by 2 ng.L−1 LPS-binding protein and thrombin. PPP with LPS and LBP was then exposed to thioflavin T (ThT) (5 μM exposure concentration) followed by adding thrombin to create extensive clot. Micrographs were taken with a Zeiss LSM 510 META confocal microscope with a Plan-Apochromatt 63x/1.4 Oil DIC objective. Nearly no fluorescence is visible.
Figure 4
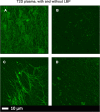
(A and C) Micrographs of PPP with added thrombin to form extensive fibrin fibres from 2 individuals with type 2 diabetes; (B and D) PPP from same individuals, but exposed to 2 ng.L−1 LPS-binding protein followed by addition of thrombin. Thioflavin T (ThT) (5 μM) was added before thrombin. Micrographs were taken with a Zeiss LSM 510 META confocal microscope with a Plan-Apochromat 63x/1.4 Oil DIC objective. LBP dramatically reduced the fluorescence seen in samples from patients with T2D.
Figure 5
(A) Representative clot structure from a healthy individual; (B) same PPP sample with added LBP; (C) same PPP sample with added LPS; (D) same PPP sample with added LPS, followed by LBP. All clots were created by adding thrombin to PPP.
Figure 6
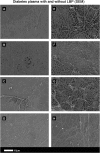
(A to D) PPP with added thrombin from 4 naïve type 2 diabetes samples (5 k machine magnification); (E to H) Same samples (5 k machine magnification) with added LBP (incubated for 10 minutes).
Figure 7
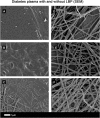
(A to C) PPP with added thrombin from 3 naïve type 2 diabetes samples (35 k machine magnification); (D to F) same samples (35 k machine magnification), with added LBP (incubated for 10 minutes).
Figure 8
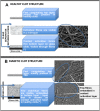
(A) Model of a fibrin clot formed from plasma from a healthy individual. (B) Model of a clot made using PPP taken from an individual with type 2 diabetes. A typical clot consists of 3 layers, fast coagulating top layer, middle fibrous layer and bottom, contact activation layer. The thickness and presence of these 3 layers vary between clots from healthy individuals and inflammatory clots.
Figure 9
(A and B) Representative histograms of the 8-bit intensity for a typical SEM clot from PPP of an individual with type 2 diabetes (T2D) (A) and after addition of LBP (B). (C and D) Representative histograms of the 8-bit intensity for a typical Airyscan clot from PPP of an individual with T2D (C) and after addition of LBP.
Figure 10
Boxplots of the distribution of the coefficients of variation (CV) of the pixel intensities of the SEM clot images from the different sample classes analysed (median CV for each group is above boxplots). Note that that the CVs of the clot structures of PPP from naïve T2D and that of healthy individuals with added LPS are both 0.41.
Similar articles
- Substantial fibrin amyloidogenesis in type 2 diabetes assessed using amyloid-selective fluorescent stains.
Pretorius E, Page MJ, Engelbrecht L, Ellis GC, Kell DB. Pretorius E, et al. Cardiovasc Diabetol. 2017 Nov 2;16(1):141. doi: 10.1186/s12933-017-0624-5. Cardiovasc Diabetol. 2017. PMID: 29096623 Free PMC article. - Lipopolysaccharide-binding protein (LBP) can reverse the amyloid state of fibrin seen or induced in Parkinson's disease.
Pretorius E, Page MJ, Mbotwe S, Kell DB. Pretorius E, et al. PLoS One. 2018 Mar 1;13(3):e0192121. doi: 10.1371/journal.pone.0192121. eCollection 2018. PLoS One. 2018. PMID: 29494603 Free PMC article. - Correlative Light-Electron Microscopy detects lipopolysaccharide and its association with fibrin fibres in Parkinson's Disease, Alzheimer's Disease and Type 2 Diabetes Mellitus.
de Waal GM, Engelbrecht L, Davis T, de Villiers WJS, Kell DB, Pretorius E. de Waal GM, et al. Sci Rep. 2018 Nov 14;8(1):16798. doi: 10.1038/s41598-018-35009-y. Sci Rep. 2018. PMID: 30429533 Free PMC article. - Proteins behaving badly. Substoichiometric molecular control and amplification of the initiation and nature of amyloid fibril formation: lessons from and for blood clotting.
Kell DB, Pretorius E. Kell DB, et al. Prog Biophys Mol Biol. 2017 Jan;123:16-41. doi: 10.1016/j.pbiomolbio.2016.08.006. Epub 2016 Aug 21. Prog Biophys Mol Biol. 2017. PMID: 27554450 Review. - Old and new findings on lipopolysaccharide-binding protein: a soluble pattern-recognition molecule.
Schumann RR. Schumann RR. Biochem Soc Trans. 2011 Aug;39(4):989-93. doi: 10.1042/BST0390989. Biochem Soc Trans. 2011. PMID: 21787335 Review.
Cited by
- Plasma lipopolysaccharide-binding protein is a biomarker for future venous thromboembolism: Results from discovery and validation studies.
Jensen SB, Latysheva N, Hindberg K, Ueland T. Jensen SB, et al. J Intern Med. 2022 Sep;292(3):523-535. doi: 10.1111/joim.13502. Epub 2022 Apr 27. J Intern Med. 2022. PMID: 35426199 Free PMC article. - Platelet activity and hypercoagulation in type 2 diabetes.
Pretorius L, Thomson GJA, Adams RCM, Nell TA, Laubscher WA, Pretorius E. Pretorius L, et al. Cardiovasc Diabetol. 2018 Nov 2;17(1):141. doi: 10.1186/s12933-018-0783-z. Cardiovasc Diabetol. 2018. PMID: 30388964 Free PMC article. - Inflammatory cytokines in type 2 diabetes mellitus as facilitators of hypercoagulation and abnormal clot formation.
Randeria SN, Thomson GJA, Nell TA, Roberts T, Pretorius E. Randeria SN, et al. Cardiovasc Diabetol. 2019 Jun 4;18(1):72. doi: 10.1186/s12933-019-0870-9. Cardiovasc Diabetol. 2019. PMID: 31164120 Free PMC article. - Serum amyloid A binds to fibrin(ogen), promoting fibrin amyloid formation.
Page MJ, Thomson GJA, Nunes JM, Engelbrecht AM, Nell TA, de Villiers WJS, de Beer MC, Engelbrecht L, Kell DB, Pretorius E. Page MJ, et al. Sci Rep. 2019 Feb 28;9(1):3102. doi: 10.1038/s41598-019-39056-x. Sci Rep. 2019. PMID: 30816210 Free PMC article. - Substantial fibrin amyloidogenesis in type 2 diabetes assessed using amyloid-selective fluorescent stains.
Pretorius E, Page MJ, Engelbrecht L, Ellis GC, Kell DB. Pretorius E, et al. Cardiovasc Diabetol. 2017 Nov 2;16(1):141. doi: 10.1186/s12933-017-0624-5. Cardiovasc Diabetol. 2017. PMID: 29096623 Free PMC article.
References
Publication types
MeSH terms
Substances
LinkOut - more resources
Full Text Sources
Other Literature Sources
Medical
Miscellaneous


