Kiss-and-Run Is a Significant Contributor to Synaptic Exocytosis and Endocytosis in Photoreceptors - PubMed (original) (raw)
Kiss-and-Run Is a Significant Contributor to Synaptic Exocytosis and Endocytosis in Photoreceptors
Xiangyi Wen et al. Front Cell Neurosci. 2017.
Abstract
Accompanying sustained release in darkness, rod and cone photoreceptors exhibit rapid endocytosis of synaptic vesicles. Membrane capacitance measurements indicated that rapid endocytosis retrieves at least 70% of the exocytotic membrane increase. One mechanism for rapid endocytosis is kiss-and-run fusion where vesicles briefly contact the plasma membrane through a small fusion pore. Release can also occur by full-collapse in which vesicles merge completely with the plasma membrane. We assessed relative contributions of full-collapse and kiss-and-run in salamander photoreceptors using optical techniques to measure endocytosis and exocytosis of large vs. small dye molecules. Incubation with small dyes (SR101, 1 nm; 3-kDa dextran-conjugated Texas Red, 2.3 nm) loaded rod and cone synaptic terminals much more readily than larger dyes (10-kDa Texas Red, 4.6 nm; 10-kDa pHrodo, 4.6 nm; 70-kDa Texas Red, 12 nm) consistent with significant uptake through 2.3-4.6 nm fusion pores. By using total internal reflection fluorescence microscopy (TIRFM) to image individual vesicles, when rods were incubated simultaneously with Texas Red and AlexaFluor-488 dyes conjugated to either 3-kDa or 10-kDa dextran, more vesicles loaded small molecules than large molecules. Using TIRFM to detect release by the disappearance of dye-loaded vesicles, we found that SR101 and 3-kDa Texas Red were released from individual vesicles more readily than 10-kDa and 70-kDa Texas Red. Although 10-kDa pHrodo was endocytosed poorly like other large dyes, the fraction of release events was similar to SR101 and 3-kDa Texas Red. We hypothesize that while 10-kDa pHrodo may not exit through a fusion pore, release of intravesicular protons can promote detection of fusion events by rapidly quenching fluorescence of this pH-sensitive dye. Assuming that large molecules can only be released by full-collapse whereas small molecules can be released by both modes, our results indicate that 50%-70% of release from rods involves kiss-and-run with 2.3-4.6 nm fusion pores. Rapid retrieval of vesicles by kiss-and-run may limit membrane disruption of release site function during ongoing release at photoreceptor ribbon synapses.
Keywords: endocytosis; exocytosis; kiss-and-run; photoreceptor cells; ribbon synapses; vertebrate.
Figures
Figure 1
Fast endocytosis in photoreceptors. Whole-cell capacitance measured in photoreceptors from retinal slices (A,B) and isolated cells (C,D) in the presence of DL-TBOA (100 μM) and CsCl (3 mM). (A,B) show responses from a cone and rod, respectively, measured in retinal slices. (C,D) show responses from an isolated cone and rod, respectively. Depolarization (−70 mV to −10 mV, 25 ms) stimulated an increase in membrane capacitance that subsequently returned to baseline due to endocytosis. Endocytic capacitance decays were fit by single exponential curves (red lines): (A) tau = 297.8 ms, amplitude (a) = 0.0320308 pF, plateau amplitude (c) = 0.026172 pF; (B) tau = 608.3, a = 0.0081128, c = −0.43617; (C) tau = 602.7, a = 0.028183, c = 0.011441; (D) tau = 599.9, a = 0.010456, c = 0.099100. Dashed line shows the initial baseline of each trace.
Figure 2
Small dyes were loaded preferentially into photoreceptor terminals over large dyes. (A) Schematic image illustrating the idea that small dyes can be endocytosed by both classical and kiss-and-run endocytosis, whereas large dyes can be engulfed by classical endocytosis but would be rejected by kiss-and-run. (B) Examples of an isolated salamander cone and rod loaded by incubation with SR101 (7 μM, 3 min). Inner segments, cell somas, and brightly fluorescent synaptic terminals are indicated by arrows. Scale bar: 5 μm. (C) SR101, 3-kDa Texas Red, 10-kDa Texas Red, 70-kDa Texas Red, and 10-kDa pHrodo (7 μM) were loaded by incubating isolated cones and rods for 3 or 10 min. Basal loading was measured by incubating cells for 10 min in Ca2+-free, high-Mg2+ saline solution with 0.1 mM Cd2+. Specific brightness of each dye (F’) relative to its concentration was measured in vitro. The relative intra-terminal concentration for each dye was calculated as follows: Relative concentration = FF′/μM where F is whole terminal fluorescence. Insets show data measured after 10-min loading at low relative concentration. Each data point is the average ± standard error of the mean (SEM) from three replicates. For each replicate, we measured intraterminal fluorescence from 5 to 70 cells (average of 48 cones/replicate and 22 rods/replicate). Basal loading in Ca2+-free, Cd2+-containing solution was significantly lower than loading for 10 min in control saline (unpaired _t_-tests: SR101: cones, P < 0.0001; rods, P = 0.0029. 3-kDa Texas Red: cones, P = 0.0128; rods, P = 0.0074. 10-kDa Texas Red: cones, P = 0.0031; rods, P = 0.0034. 70-kDa Texas Red: cones, P < 0.0001; rods, P = 0.015. pHrodo, cones, P = 0.0003; rods, P < 0.0001).
Figure 3
Dyes were loaded into synaptic vesicles. (A,B) Fluorescence (ΔF/F) of SR101, 3-, 10- and 70-kDa Texas Red declined upon application of 50 mM K+ in both cones (A) and rods (B). Slices were incubated with SR 101 (83 μM, 30 min), 3-kDa Texas Red (133 μM, 45 min), 10-kDa Texas Red (100 μM, 60 min), and 70-kDa Texas Red (36 μM, 60 min). Each experiment was repeated three times and each data point shows the average ± SEM from 8 to 44 terminals. The capability of dyes to be released from retinal slices by depolarizing stimulation indicates they were loaded into releasable synaptic vesicles. (C–J) Electron micrographs of photoreceptor terminals loaded with lysine-fixable, 3-kDa Texas Red (7 μM). After photoconversion in the presence of DAB, electron dense precipitate can be seen in vesicles throughout the terminals. A cone terminal with its characteristically small ribbons (arrowheads) is shown in (C) and a rod terminal with its larger ribbons (arrowheads) in (E). Panels (D,F) show magnified views of the square regions in (C,E), respectively. (G–J) Electron micrograph of a photoreceptor terminal loaded with 10-kDa Texas Red (7 μM). (G,I) show a cone and a rod terminal, respectively. (H,J) show magnified views of the square regions in (G,I).
Figure 4
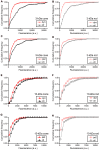
Sensitivity of small and large dyes to endocytic inhibitors. Cumulative frequency histograms of whole-terminal fluorescence measured in rods and cones after incubation with 3-kDa or 10-kDa Texas Red. Retinas were incubated for 20 min in a test solution (dynasore, pitstop-2, or vehicle control) and then another 10 min in test solution supplemented with 3-kDa (67 μM) or 10-kDa Texas Red (50 μM). Retinal cells were then isolated and plated onto coverslips. Data in each condition were obtained from multiple cells in three replicate experiments. (A) Cones loaded with 3-kDa Texas Red and treated with dynasore (80 μM, N = 122 cells) or vehicle control (0.1% DMSO, N = 124). The cumulative distributions of intraterminal fluorescence differed significantly by a Kolmogorov–Smirnov test (P < 0.0001). (B) Rods loaded with 3-kDa Texas Red and treated with dynasore (N = 123) or vehicle control (N = 124; P < 0.0001, Kolmogorov–Smirnov test). (C) Cones loaded with 3-kDa Texas Red and treated with pitstop-2 (25 μM, N = 126) or vehicle control (0.2% DMSO, N = 126; P < 0.0001). (D) Rods loaded with 3-kDa Texas Red and treated with pitstop-2 (N = 125) or vehicle control (N = 125; P = 0.002). (E) Cones loaded with 10-kDa Texas Red and treated with dynasore (N = 124) or vehicle control (N = 123; P < 0.0001). (F) Rods loaded with 10-kDa Texas Red and treated with dynasore (N = 124) or vehicle control (N = 124; P = 0.035). (G) Cones loaded with 10-kDa Texas Red and treated with pitstop-2 (N = 126) or vehicle control (N = 125; P < 0.0001). (H) Rods loaded with 10-kDa Texas Red and treated with pitstop-2 (N = 125) or vehicle control (N = 124; P < 0.0001).
Figure 5
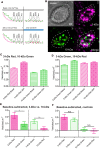
By incubating rods simultaneously in red and green dyes, total internal reflection fluorescence microscopy (TIRFM) imaging of individual synaptic vesicles showed that more vesicles were loaded with small dyes than large dyes. (A) Loading protocol: We incubated retinal pieces for 2 min in Ca2+-free, high-Mg2+ saline to equilibrate dye throughout the retina. To measure basal loading, we maintained retinas for another 2 min in Ca2+-free saline. To measure depolarization-evoked loading, we incubated retinas for the final 2 min in 20 mM K+/1.8 mM Ca2+. (B1) Bright-field image of an isolated rod terminal. (B2) Average TIRFM image (30 × 40 ms/frame, 140-ms intervals) of the same terminal showed many fluorescent vesicles (yellow circles) after incubation with 3-kDa Texas Red. Vesicle brightness in these average images was largely a function of the time each vesicle spent in the evanescent field near the membrane during the trial. (B3) Simultaneous incubation with 10-kDa AlexaFluor-488 loaded fewer vesicles. (B4) Merged image of 3-kDa Texas Red (magenta) and 10-kDa AlexFluor-488 (green) dyes. Scale bar: 2.5 μm. (C,D) Bar graphs show vesicles/μm2 observed using TIRFM under basal Ca2+-free and 20 mM high-K+ conditions. 3-kDa Texas Red vs. 10-kDa AlexaFluor-488 in (C; basal: N = 83 terminals; 20-K+: N = 108); 3-kDa AlexaFluor-488 vs. 10-kDa Texas Red in (D; basal: N = 132; 20-K+: N = 109). (E,F) Bar graphs show vesicles/μm2 observed with high-K+ stimulation after subtracting basal loading. Panel (E) compares loading of 3-kDa vs. 10-kDa dyes. Panel (F) shows control experiments comparing loading of 3-kDa Texas Red vs. 3-kDa AlexFluor-488 (basal: N = 132; 20-K+: N = 116) and 10-kDa Texas Red vs. 10-kDa AlexFluor-488 dyes (basal: N = 113; 20-K+: N = 122). *P < 0.05, **_P_ < 0.01, N.S. _P_ > 0.05 (_t_-test).
Figure 6
Imaging of individual vesicle release events using TIRFM in rods. Consecutive 40-ms images showing a non-release event (A) and release event (B) in individual synaptic vesicles loaded with SR101. Scale bars: 0.5 μm. (C) Fluorescence changes were measured within a 7 × 7 pixel region of interest enclosing the vesicles in (A; top) and (B; bottom) and plotted as a function of time. Vertical line aligns the peak fluorescence values. Vesicle fluorescence declined more rapidly during release than during non-release events in which fluorescence declined at a rate similar to the rate of increase observed as a vesicle approached the membrane. (D,E) Scatter plots of normalized fluorescence values measured in individual vesicles during the final two 40-ms frames of vesicle approach to the membrane and the first two frames during fluorescence decline. Data show vesicles loaded with SR101 (N = 143 events) (D) and 70-kDa Texas Red (N = 142) (E) during 50 mM K+ puff.
Figure 7
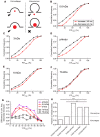
Two modes of synaptic vesicle exocytosis. (A) Schematic image illustrating that small dyes can be released by both full-collapse and kiss-and-run exocytosis, whereas large dyes can only be released by full-collapse. (B–F) Cumulative histograms of relative fluorescence values measured in individual vesicles one 40-ms frame before the peak (increase; red filled circles) and one frame after peak fluorescence was attained (decrease; black open circles). (G) Differences in cumulative frequency between fluorescence decrease and increase from (B–F) used to assess the fraction of events due to release. (H) Bar graph of release fractions determined from the maximum difference in cumulative frequency for each dye in (G). Fractions of release events seen with SR101 (N = 143 events), 3-kDa Texas Red (N = 315), and pHrodo (N = 181) were significantly greater than fractions of release events seen with 10-kDa (N = 213) and 70-kDa Texas Red (N = 142). **P < 0.01, ***P < 0.001 (_z_-test: pHrodo vs. 10-kDa Texas Red: P < 0.0001; pHrodo vs. 70-kDa Texas Red: P < 0.0001; SR101 vs. 10-kDa Texas Red: P = 0.0034; SR101 vs. 70-kDa Texas Red: P = 0.0002; 3-kDa Texas Red vs. 10-kDa Texas Red: P = 0.0008; 3-kDa Texas Red vs. 70-kDa Texas Red: P < 0.0001).
Similar articles
- Properties of ribbon and non-ribbon release from rod photoreceptors revealed by visualizing individual synaptic vesicles.
Chen M, Van Hook MJ, Zenisek D, Thoreson WB. Chen M, et al. J Neurosci. 2013 Jan 30;33(5):2071-86. doi: 10.1523/JNEUROSCI.3426-12.2013. J Neurosci. 2013. PMID: 23365244 Free PMC article. - Kiss-and-run and full-collapse fusion as modes of exo-endocytosis in neurosecretion.
Harata NC, Aravanis AM, Tsien RW. Harata NC, et al. J Neurochem. 2006 Jun;97(6):1546-70. doi: 10.1111/j.1471-4159.2006.03987.x. J Neurochem. 2006. PMID: 16805768 Review. - Endocytosis sustains release at photoreceptor ribbon synapses by restoring fusion competence.
Wen X, Van Hook MJ, Grassmeyer JJ, Wiesman AI, Rich GM, Cork KM, Thoreson WB. Wen X, et al. J Gen Physiol. 2018 Apr 2;150(4):591-611. doi: 10.1085/jgp.201711919. Epub 2018 Mar 19. J Gen Physiol. 2018. PMID: 29555658 Free PMC article. - Real-time three-dimensional tracking of single synaptic vesicles reveals that synaptic vesicles undergoing kiss-and-run fusion remain close to their original fusion site before reuse.
Qin X, Tsien RW, Park H. Qin X, et al. Biochem Biophys Res Commun. 2019 Jun 30;514(3):1004-1008. doi: 10.1016/j.bbrc.2019.05.043. Epub 2019 May 12. Biochem Biophys Res Commun. 2019. PMID: 31092326 - Synaptic vesicle endocytosis: fast and slow modes of membrane retrieval.
Smith SM, Renden R, von Gersdorff H. Smith SM, et al. Trends Neurosci. 2008 Nov;31(11):559-68. doi: 10.1016/j.tins.2008.08.005. Epub 2008 Sep 24. Trends Neurosci. 2008. PMID: 18817990 Free PMC article. Review.
Cited by
- Role of Clathrin and Dynamin in Clathrin Mediated Endocytosis/Synaptic Vesicle Recycling and Implications in Neurological Diseases.
Prichard KL, O'Brien NS, Murcia SR, Baker JR, McCluskey A. Prichard KL, et al. Front Cell Neurosci. 2022 Jan 18;15:754110. doi: 10.3389/fncel.2021.754110. eCollection 2021. Front Cell Neurosci. 2022. PMID: 35115907 Free PMC article. Review. - SNARE Regulatory Proteins in Synaptic Vesicle Fusion and Recycling.
Sauvola CW, Littleton JT. Sauvola CW, et al. Front Mol Neurosci. 2021 Aug 6;14:733138. doi: 10.3389/fnmol.2021.733138. eCollection 2021. Front Mol Neurosci. 2021. PMID: 34421538 Free PMC article. Review. - Mechanics of Pollen Tube Elongation: A Perspective.
Adhikari PB, Liu X, Kasahara RD. Adhikari PB, et al. Front Plant Sci. 2020 Oct 20;11:589712. doi: 10.3389/fpls.2020.589712. eCollection 2020. Front Plant Sci. 2020. PMID: 33193543 Free PMC article. Review. - Daily mitochondrial dynamics in cone photoreceptors.
Giarmarco MM, Brock DC, Robbings BM, Cleghorn WM, Tsantilas KA, Kuch KC, Ge W, Rutter KM, Parker ED, Hurley JB, Brockerhoff SE. Giarmarco MM, et al. Proc Natl Acad Sci U S A. 2020 Nov 17;117(46):28816-28827. doi: 10.1073/pnas.2007827117. Epub 2020 Nov 3. Proc Natl Acad Sci U S A. 2020. PMID: 33144507 Free PMC article. - Transmission at rod and cone ribbon synapses in the retina.
Thoreson WB. Thoreson WB. Pflugers Arch. 2021 Sep;473(9):1469-1491. doi: 10.1007/s00424-021-02548-9. Epub 2021 Mar 29. Pflugers Arch. 2021. PMID: 33779813 Free PMC article. Review.
References
LinkOut - more resources
Full Text Sources
Other Literature Sources


