Rufy3 is an adapter protein for small GTPases that activates a Rac guanine nucleotide exchange factor to control neuronal polarity - PubMed (original) (raw)
Rufy3 is an adapter protein for small GTPases that activates a Rac guanine nucleotide exchange factor to control neuronal polarity
Atsuko Honda et al. J Biol Chem. 2017.
Abstract
RUN and FYVE domain-containing 3 (Rufy3) is an adapter protein for small GTPase proteins and is bound to activated Rap2, a Ras family protein in the developing neuron. Previously, we reported the presence of a rapid cell polarity determination mechanism involving Rufy3, which is likely required for in vivo neuronal development. However, the molecular details of this mechanism are unclear. To this end, here we produced Rufy3 knock-out (Rufy3-KO) mice to study the role of Rufy3 in more detail. Examining Rufy3-KO neurons, we found that Rufy3 is recruited via glycoprotein M6A to detergent-resistant membrane domains, which are biochemically similar to lipid rafts. We also clarified that Rufy3, as a component of a ternary complex, induces the assembly of Rap2 in the axonal growth cone, whereas in the absence of Rufy3, the accumulation of a Rac guanine nucleotide exchange factor, T-cell lymphoma invasion and metastasis 2 (Tiam2/STEF), is inhibited downstream of Rap2. We also found that Rufy3 regulates the cellular localization of Rap2 and Tiam2/STEF. Taken together, we conclude that Rufy3 is a physiological adapter for Rap2 and activates Tiam2/STEF in glycoprotein M6A-regulated neuronal polarity and axon growth.
Keywords: cell polarity; lipid raft; neurite outgrowth; neurodevelopment; small GTPase.
© 2017 by The American Society for Biochemistry and Molecular Biology, Inc.
Conflict of interest statement
The authors declare that they have no conflicts of interest with the contents of this article
Figures
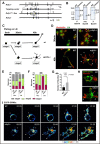
Figure 1.
Generation of Rufy3-KO mice and abnormalities in the polarity of their neurons. A, strategy for conditional inactivation of the mouse Rufy3 gene. B, BamHI site; Neo, neomycin resistance gene; DT, diphtheria toxin gene. B, Southern blot analysis of genomic DNA isolated from WT ES cells and chimeric clones. The DNA was digested with BamHI and hybridized with 5′ and 3′ probes. Each band was detected at the expected size. C, schematic models of the time course in neuronal polarity determination of the cultured neurons plated on LN. The schematics show the representative neuronal shapes at each time point. Developmental stages of the neurons were morphologically defined according to the definition of Dotti et al. (19); i.e. stage 1, cells with no neurite (gray); stage 2, multipolar cells (green); and stage 3, polarized cells (pink). In the WT, the neurons dramatically changed from stage 1 to 3 within 1–4 h after plating on LN. In contrast, the _gpm6a_−/− neurons still remained at stages 1 to 2 at the same time course (see Ref. 9). D–G, cortical neurons derived from WT or _rufy3_−/− mice were cultured for 30 min or 48 h on LN. D, the plasma membrane (green) and F-actin (red) were stained using DiI and phalloidin, respectively. Scale bars, 50 (upper) and 20 μm (lower). E and F, percentage of neurons at stage 1, 2, or 3 from WT or _rufy3_−/− mice plated for 30 min (E) or 48 h (F) on LN (see also Ref. 9) (one-way analysis of variance with Tukey's multiple comparisons test; n 500 cells (E) and n 300 cells (F) for each group; error bars represent S.D. of the percentage of the stage 3 neurons in each group). G, the numbers of neurites of WT or _rufy3_−/− mice after 48-h culture (two-tailed t test (means ± S.D.); WT (1.203 ± 0.661) _versus rufy3_−/− (3.00 ± 1.944); ****, p < 0.0001; n = 300 from five distinct preparations; error bars represent S.D.). H, in LN-dependent cultures, growth cones (arrowheads) protruded from a GPM6a (green)-enriched membrane area (asterisk) in the cortical neurons from WT but not from _rufy3_−/− mice. Scale bar, 20 μm. I, time-lapse imaging of EGFP-GPM6a overexpressed in the cortical neurons of WT and _rufy3_−/− mice for 80 min after plating on LN. The fluorescence intensities of EGFP-GPM6a are shown as pseudocolor images. Neurites (arrowheads) protruded from the GPM6a-enriched membrane area (asterisk) in WT but not in _rufy3_−/−. Scale bar, 20 μm. PLL, poly-
l
-lysine.
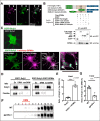
Figure 2.
Rufy3 is translocated to detergent-resistant membrane fractions through its interaction with GPM6a. A, immunofluorescence of endogenous GPM6a (magenta) and Rufy3 (green) in the growth cone of neurons plated on LN for 72 h. The proteins colocalized in the P-domain of the axonal growth cone (arrow). Scale bar, 5 μm. B, GPM6a-binding domain of Rufy3, visualized using a pulldown assay of FLAG-GPM6a with EGFP-Rufy3. EGFP-tagged full length (aa 1–487), N terminus + RUN domain (aa 1–255), two coiled-coil domains (CC1 + CC2 domains; aa 255–487), and RUN-CC1 (aa 83–396) of Rufy3 were coexpressed with FLAG-GPM6a in COS-7 cells. EGFP-Rufy3 fragments and coimmunoprecipitation (IP) of GPM6a were detected with both anti-GFP and anti-FLAG antibodies using Western blotting (WB), respectively. C, EGFP-Rufy3 (green) changes its localization upon coexpression with mCherry-GPM6a (magenta) in COS-7 cells. The translocated EGFP-GPM6a was colocalized with mCherry-GPM6a at the tips of the protrusions (arrow). A high magnification image of the protrusions in the inset is shown in the left panel. Scale bar, 10 μm. D and E, translocation of EGFP-Rufy3 to DRM fractions, induced by coexpression of FLAG-GPM6a in COS-7 cells, with or without FLAG-GPM6a. D, translocation of EGFP-Rufy3, induced by coexpression of FLAG-GPM6a in COS-7 cells, with or without FLAG-GPM6a. The cells were lysed using 1% Brij98, and the whole-cell extract (Ex) was fractionated into DRM and non-DRM fractions. The cells were lysed using 1% Brij 98 and fractionated into DRM and non-DRM fractions. The distribution of EGFP-Rufy3 was analyzed using EGFP antibody. Endogenous flotillin 1 was used as a lipid raft marker. EGFP-Rufy3 was partially translocated from the non-DRM to the DRM fractions. E, ratio of immunofluorescence of EGFP-Rufy3 in the DRM fractions to that in total EGFP-Rufy3 (two-tailed t test (means ± S.E.); Rufy3 (2.41 ± 0.25) versus Rufy3 + GPM6a (11.22 ± 0.74); ****, p < 0.0001; n = 5; error bars represent S.E.). F, differential localization of endogenous Rufy3 between WT and GPM6a-KO brains. Homogenized brains (E14.5 WT or _gpm6a_−/− embryos) were treated with 1% Brij 98, DRMs were fractionated, and the distribution of Rufy3 was analyzed as described above. In WT but not in _gpm6a_−/−, Rufy3 was partially distributed in the DRM fractions. G, ratio of Rufy3 in the DRM fractions to its total amount (two-tailed t test (means ± S.E.); WT (5.45 ± 0.2452) _versus gpm6a_−/− (2.085 ± 0.3087); ****, p < 0.0001; n = 5; error bars represent S.E.).
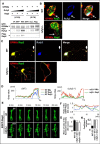
Figure 3.
Rufy3 mediates Rap2 accumulation in the growth cone through a GPM6a-Rufy3-Rap2 ternary complex. A, Rufy3 induced the formation of a GPM6a-Rufy3-Rap2 ternary complex. EGFP-GPM6a and Myc-Rufy3 were incubated with either FLAG-Rap2V12G or FLAG-Rap2S17N. The concentration of Myc-Rufy3 changed according to the concentration of FLAG-Rap2V12G or FLAG-Rap2S17N. EGFP-GPM6a and its binding proteins were immunoprecipitated (IP) with anti-EGFP antibody (arrows). B and C, immunofluorescence staining of cortical neurons at 30 min (B) and 48 h (C) and after plating on LN using anti-GPM6a (red), anti-Rufy3 (blue), and anti-Rap2 (green) antibodies. In WT neurons, GPM6a was assembled at the protruding site (arrow) and colocalized with Rufy3 and Rap2. In contrast, in _rufy3_−/− neurons, GPM6a and Rap2 were not assembled (arrow). In _rufy3_−/− neurons with multiple axons (C), the highlighted region (left) is shown enlarged (right). D, immunofluorescence intensity profiles of anti-GPM6a (red), -Rufy3 (green), and -Rap2 (blue) from the axon shaft to the growth cone (tip) shown as dotted lines in the photograph in C. E–H, in _rufy3_−/− neurons, the accumulation of Rap2 is not sustained in the growth cone. E, six sequential images (4 min per frame) of EGFP-Rap2 expressed in WT or _rufy3_−/− neurons at 24 h after plating on LN. The analyzed axonal growth cones (GC) are highlighted. F and G, chronological changes (F) and means (G) in the ratio of EGFP-Rap2 fluorescence intensity in the growth cone to that in the axon (mean ± S.D.; WT GC/axon, 1.20 ± 0.07; _rufy3_−/− GC1/axon, 1.00 ± 0.20; _rufy3_−/− GC2/axon, 0.96 ± 0.19; error bars represent S.D.). Coefficients of variation in G are shown in H. Scale bar, 20 μm (B, C, and E). WB, Western blotting.
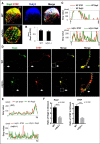
Figure 4.
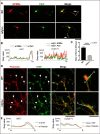
Loss of Rufy3 disrupts the assembly of both proteins downstream of Rufy3. A, immunofluorescence staining of endogenous STEF (red), Rap2 (green), and Rufy3 (blue) in WT and _rufy3_−/− cortical neurons at 30 min after plating on LN. Scale bar, 20 μm. B, colocalization of endogenous Rap2 and STEF in WT and _rufy3_−/− cortical neurons is shown as the mean correlation index (Icorr). C, detailed fluorescence plot profiles of each fluorescence image along the I–II lines are shown. D, immunofluorescence staining of STEF (red), Rap2 (green), and Rufy3 (blue) in WT and _rufy3_−/− cortical neurons at 48 h after plating on LN. The highlighted regions (left panels) are shown enlarged (right). Arrows, growth cones. Scale bars, 30 (left panels) and 15 μm (right panels). E, immunofluorescence intensity profiles of anti-STEF (red) and -Rap2 (green) from the axon shaft to the growth cone (GC) shown as dotted lines in the photograph in D. F, ratio of the immunofluorescence intensity of Rap2 or STEF in the growth cone versus that of the axon (two-tailed t test (means ± S.E.); Rap2, WT (3.141 ± 0.178) _versus rufy3_−/− (1.175 ± 0.101); ****, p < 0.0001; STEF, WT (3.506 ± 0.244) _versus rufy3_−/− (1.115 ± 0.049); ****, p < 0.0001; n = 30 for each sample; error bars represent S.E.).
Figure 5.
Loss of Rufy3 disturbs the accumulation of neuronal polarity determinants in the growth cone. A, immunofluorescence staining of GPM6a (red) and Par3 (green) in WT and _rufy3_−/− cortical neurons (48 h after plating on LN). Arrows, growth cones. Scale bar, 50 μm. B, immunofluorescence intensity plot profiles of anti-GPM6a (red) and anti-Rufy3 (green) from the axon shaft to the growth cone (tip) are shown as dotted lines in A. C, ratio of the immunofluorescence intensity of Par3 in the growth cone versus that of the axon (two-tailed t test (means ± S.E.); WT (2.87 ± 0.23) _versus rufy3_−/− (1.06 ± 0.07); ****, p < 0.0001; n = 25; error bars represent S.E.). D, immunofluorescence staining of phalloidin (red) and anti-STEF antibody (green) in WT and _rufy3_−/− cortical neurons (48 h after plating on LN). High magnification images of insets are shown in the left panels. Arrows, growth cones. Scale bars, 100 (left) and 20 μm (right). E, detailed fluorescence plot profiles of each fluorescence image along the a–b lines in D are shown.
Similar articles
- Roles of Rufy3 in experimental subarachnoid hemorrhage-induced early brain injury via accelerating neuronal axon repair and synaptic plasticity.
Wang Y, Xu J, You W, Shen H, Li X, Yu Z, Li H, Chen G. Wang Y, et al. Mol Brain. 2022 Apr 23;15(1):35. doi: 10.1186/s13041-022-00919-6. Mol Brain. 2022. PMID: 35461284 Free PMC article. - Extracellular Signals Induce Glycoprotein M6a Clustering of Lipid Rafts and Associated Signaling Molecules.
Honda A, Ito Y, Takahashi-Niki K, Matsushita N, Nozumi M, Tabata H, Takeuchi K, Igarashi M. Honda A, et al. J Neurosci. 2017 Apr 12;37(15):4046-4064. doi: 10.1523/JNEUROSCI.3319-16.2017. Epub 2017 Mar 8. J Neurosci. 2017. PMID: 28275160 Free PMC article. - PAR-6-PAR-3 mediates Cdc42-induced Rac activation through the Rac GEFs STEF/Tiam1.
Nishimura T, Yamaguchi T, Kato K, Yoshizawa M, Nabeshima Y, Ohno S, Hoshino M, Kaibuchi K. Nishimura T, et al. Nat Cell Biol. 2005 Mar;7(3):270-7. doi: 10.1038/ncb1227. Epub 2005 Feb 20. Nat Cell Biol. 2005. PMID: 15723051 - The guanine nucleotide exchange factor Tiam1: a Janus-faced molecule in cellular signaling.
Boissier P, Huynh-Do U. Boissier P, et al. Cell Signal. 2014 Mar;26(3):483-91. doi: 10.1016/j.cellsig.2013.11.034. Epub 2013 Dec 2. Cell Signal. 2014. PMID: 24308970 Review. - Mechanisms and consequences of dysregulation of the Tiam family of Rac activators in disease.
Maltas J, Reed H, Porter A, Malliri A. Maltas J, et al. Biochem Soc Trans. 2020 Dec 18;48(6):2703-2719. doi: 10.1042/BST20200481. Biochem Soc Trans. 2020. PMID: 33200195 Review.
Cited by
- Roles of Rufy3 in experimental subarachnoid hemorrhage-induced early brain injury via accelerating neuronal axon repair and synaptic plasticity.
Wang Y, Xu J, You W, Shen H, Li X, Yu Z, Li H, Chen G. Wang Y, et al. Mol Brain. 2022 Apr 23;15(1):35. doi: 10.1186/s13041-022-00919-6. Mol Brain. 2022. PMID: 35461284 Free PMC article. - RUFY3 regulates endolysosomes perinuclear positioning, antigen presentation and migration in activated phagocytes.
Char R, Liu Z, Jacqueline C, Davieau M, Delgado MG, Soufflet C, Fallet M, Chasson L, Chapuy R, Camosseto V, Strock E, Rua R, Almeida CR, Su B, Lennon-Duménil AM, Nal B, Roquilly A, Liang Y, Méresse S, Gatti E, Pierre P. Char R, et al. Nat Commun. 2023 Jul 18;14(1):4290. doi: 10.1038/s41467-023-40062-x. Nat Commun. 2023. PMID: 37463962 Free PMC article. - Molecular basis of the functions of the mammalian neuronal growth cone revealed using new methods.
Igarashi M. Igarashi M. Proc Jpn Acad Ser B Phys Biol Sci. 2019;95(7):358-377. doi: 10.2183/pjab.95.026. Proc Jpn Acad Ser B Phys Biol Sci. 2019. PMID: 31406059 Free PMC article. Review. - Multiomic analysis implicates nuclear hormone receptor signalling in clustering epilepsy.
de Nys R, van Eyk CL, Ritchie T, Møller RS, Scheffer IE, Marini C, Bhattacharjee R, Kumar R, Gecz J. de Nys R, et al. Transl Psychiatry. 2024 Jan 27;14(1):65. doi: 10.1038/s41398-024-02783-5. Transl Psychiatry. 2024. PMID: 38280856 Free PMC article. Review. - Neuronally Enriched RUFY3 Is Required for Caspase-Mediated Axon Degeneration.
Hertz NT, Adams EL, Weber RA, Shen RJ, O'Rourke MK, Simon DJ, Zebroski H, Olsen O, Morgan CW, Mileur TR, Hitchcock AM, Sinnott Armstrong NA, Wainberg M, Bassik MC, Molina H, Wells JA, Tessier-Lavigne M. Hertz NT, et al. Neuron. 2019 Aug 7;103(3):412-422.e4. doi: 10.1016/j.neuron.2019.05.030. Epub 2019 Jun 17. Neuron. 2019. PMID: 31221560 Free PMC article.
References
- Cromm P. M., Spiegel J., Grossmann T. N., and Waldmann H. (2015) Direct modulation of small GTPase activity and function. Angew. Chem. Int. Ed. Engl. 54, 13516–13537 - PubMed
- Kukimoto-Niino M., Takagi T., Akasaka R., Murayama K., Uchikubo-Kamo T., Terada T., Inoue M., Watanabe S., Tanaka A., Hayashizaki Y., Kigawa T., Shirouzu M., and Yokoyama S. (2006) Crystal structure of the RUN domain of the RAP2-interacting protein x. J. Biol. Chem. 281, 31843–31853 - PubMed
- Igarashi M. (2014) Proteomic identification of the molecular basis of mammalian CNS growth cones. Neurosci. Res. 88, 1–15 - PubMed
Publication types
MeSH terms
Substances
LinkOut - more resources
Full Text Sources
Other Literature Sources
Molecular Biology Databases
Research Materials
Miscellaneous
