Effects of supplemented isoenergetic diets varying in cereal fiber and protein content on the bile acid metabolic signature and relation to insulin resistance - PubMed (original) (raw)
Randomized Controlled Trial
Effects of supplemented isoenergetic diets varying in cereal fiber and protein content on the bile acid metabolic signature and relation to insulin resistance
Martin O Weickert et al. Nutr Diabetes. 2018.
Abstract
Bile acids (BA) are potent metabolic regulators influenced by diet. We studied effects of isoenergetic increases in the dietary protein and cereal-fiber contents on circulating BA and insulin resistance (IR) in overweight and obese adults. Randomized controlled nutritional intervention (18 weeks) in 72 non-diabetic participants (overweight/obese: 29/43) with at least one further metabolic risk factor. Participants were group-matched and allocated to four isoenergetic supplemented diets: control; high cereal fiber (HCF); high-protein (HP); or moderately increased cereal fiber and protein (MIX). Whole-body IR and insulin-mediated suppression of hepatic endogenous glucose production were measured using euglycaemic-hyperinsulinemic clamps with [6-62H2] glucose infusion. Circulating BA, metabolic biomarkers, and IR were measured at 0, 6, and 18 weeks. Under isoenergetic conditions, HP-intake worsened IR in obese participants after 6 weeks (M-value: 3.77 ± 0.58 vs. 3.07 ± 0.44 mg/kg/min, p = 0.038), with partial improvement back to baseline levels after 18 weeks (3.25 ± 0.45 mg/kg/min, p = 0.089). No deleterious effects of HP-intake on IR were observed in overweight participants. HCF-diet improved IR in overweight participants after 6 weeks (M-value 4.25 ± 0.35 vs. 4.81 ± 0.31 mg/kg/min, p = 0.016), but did not influence IR in obese participants. Control and MIX diets did not influence IR. HP-induced, but not HCF-induced changes in IR strongly correlated with changes of BA profiles. MIX-diet significantly increased most BA at 18 weeks in obese, but not in overweight participants. BA remained unchanged in controls. Pooled BA concentrations correlated with fasting fibroblast growth factor-19 (FGF-19) plasma levels (r = 0.37; p = 0.003). Higher milk protein intake was the only significant dietary predictor for raised total and primary BA in regression analyses (total BA, p = 0.017; primary BA, p = 0.011). Combined increased intake of dietary protein and cereal fibers markedly increased serum BA concentrations in obese, but not in overweight participants. Possible mechanisms explaining this effect may include compensatory increases of the BA pool in the insulin resistant, obese state; or defective BA transport.
Conflict of interest statement
The authors declare that they have no conflict of interest.
Figures
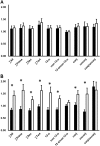
Fig. 1. Comparison of bile acids (BA) circulating concentrations between obese (n = 43; white bars) and overweight (n = 29; black bars) participants in the pooled cohort, irrespective of the dietary groups.
The graph shows changes relative to the baseline values (week 0) after a 6 weeks and b 18 weeks of dietary intervention. *Statistically significant at alpha < 0.05. ∑All: sum of all BA; ∑Prim: sum of primary BA; ∑Sec: sum of secondary BA; ∑Tert: sum of tertiary BA; 12-α: 12-α hydroxyl BA; non 12-α: non 12-α hydroxylated BA; 12-α/non 12-α: ratio of 12-α hydroxyl BA to non 12-α hydroxylated BA; Conj: conjugated BA; Unconj: unconjugated BA; Conj/Unconj: ratio of conjugated to unconjugated BA
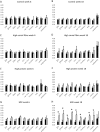
Fig. 2. Comparison of circulating bile acids (BA) concentrations, relative to baseline value at week 0, after 6 and 18 weeks between obese (ob) and overweight (ow) subjects in the 4 diet groups
: a Control at 6 weeks (ow/ob: n = 10/10). b Control at 18 weeks (ow/ob: n = 10/10). c High cereal fiber (HCF) at 6 weeks (ow/ob: n = 5/10). d HCF at 18 weeks (ow/ob: n = 5/10). e High protein (HP) at 6 weeks (ow/ob: n = 6/12); f HP at 18 weeks (ow/ob: n = 6/12). g Mixed-diet (MIX) group at 6 weeks (ow/ob: n = 8/11). h MIX at 18 weeks (ow/ob: n = 8/11). Black bars: overweight; white bars: obese. *Statistically significant at alpha < 0.05. ∑All: sum of all BA; ∑Prim: sum of primary BA; ∑Sec: sum of secondary BA; ∑Tert: sum of tertiary BA; 12-α: 12-α hydroxyl BA; non 12-α: non 12-α hydroxylated BA; 12-α/non 12-α: ratio of 12-α hydroxyl BA to non 12-α hydroxylated BA; Conj: conjugated BA; Unconj: unconjugated BA; Conj/Unconj: ratio of conjugated to unconjugated BA
Fig. 3. Partial correlation plots for circulating bile acids (BA) vs. fibroblast growth factor-19 (FGF-19) plasma concentrations, corrected for age and body mass index (BMI), measured after 18 weeks of dietary intervention.
a All study subjects: all BA pooled vs. FGF-19 (n = 68). b All study subjects: 12-alpha BA vs. FGF-19 (n = 68). c Control group only: all pooled BA vs. FGF-19 (n = 18). d High cereal fiber group (HCF) only: all pooled BA vs. FGF-19 (n = 15). e High protein (HP) group only: all pooled BA vs. FGF-19 (n = 17). f Mixed-diet (MIX) group only: all pooled BA vs. FGF-19 (n = 18). R correlation coefficient
Similar articles
- Effects of supplemented isoenergetic diets differing in cereal fiber and protein content on insulin sensitivity in overweight humans.
Weickert MO, Roden M, Isken F, Hoffmann D, Nowotny P, Osterhoff M, Blaut M, Alpert C, Gögebakan O, Bumke-Vogt C, Mueller F, Machann J, Barber TM, Petzke KJ, Hierholzer J, Hornemann S, Kruse M, Illner AK, Kohl A, Loeffelholz CV, Arafat AM, Möhlig M, Pfeiffer AF. Weickert MO, et al. Am J Clin Nutr. 2011 Aug;94(2):459-71. doi: 10.3945/ajcn.110.004374. Epub 2011 Jun 1. Am J Clin Nutr. 2011. PMID: 21633074 Clinical Trial. - Modulation of amino acid metabolic signatures by supplemented isoenergetic diets differing in protein and cereal fiber content.
Hattersley JG, Pfeiffer AF, Roden M, Petzke KJ, Hoffmann D, Rudovich NN, Randeva HS, Vatish M, Osterhoff M, Goegebakan Ö, Hornemann S, Nowotny P, Machann J, Hierholzer J, von Loeffelholz C, Möhlig M, Arafat AM, Weickert MO. Hattersley JG, et al. J Clin Endocrinol Metab. 2014 Dec;99(12):E2599-609. doi: 10.1210/jc.2014-2302. J Clin Endocrinol Metab. 2014. PMID: 25157543 Clinical Trial. - Changes in dominant groups of the gut microbiota do not explain cereal-fiber induced improvement of whole-body insulin sensitivity.
Weickert MO, Arafat AM, Blaut M, Alpert C, Becker N, Leupelt V, Rudovich N, Möhlig M, Pfeiffer AF. Weickert MO, et al. Nutr Metab (Lond). 2011 Dec 17;8:90. doi: 10.1186/1743-7075-8-90. Nutr Metab (Lond). 2011. PMID: 22177085 Free PMC article. - Impact of Dietary Fiber Consumption on Insulin Resistance and the Prevention of Type 2 Diabetes.
Weickert MO, Pfeiffer AFH. Weickert MO, et al. J Nutr. 2018 Jan 1;148(1):7-12. doi: 10.1093/jn/nxx008. J Nutr. 2018. PMID: 29378044 Review. - Obesity, insulin resistance, and cardiovascular disease.
Reaven G, Abbasi F, McLaughlin T. Reaven G, et al. Recent Prog Horm Res. 2004;59:207-23. doi: 10.1210/rp.59.1.207. Recent Prog Horm Res. 2004. PMID: 14749503 Review.
Cited by
- Dose-dependent effects of insoluble fibre on glucose metabolism: a stratified post hoc analysis of the Optimal Fibre Trial (OptiFiT).
Kabisch S, Honsek C, Kemper M, Gerbracht C, Arafat AM, Birkenfeld AL, Dambeck U, Osterhoff MA, Weickert MO, Pfeiffer AFH. Kabisch S, et al. Acta Diabetol. 2021 Dec;58(12):1649-1658. doi: 10.1007/s00592-021-01772-0. Epub 2021 Jul 12. Acta Diabetol. 2021. PMID: 34254189 Free PMC article. - Physiological Role of Bile Acids Modified by the Gut Microbiome.
Kiriyama Y, Nochi H. Kiriyama Y, et al. Microorganisms. 2021 Dec 30;10(1):68. doi: 10.3390/microorganisms10010068. Microorganisms. 2021. PMID: 35056517 Free PMC article. Review. - Impact of Dietary Fiber on Inflammation in Humans.
Kabisch S, Hajir J, Sukhobaevskaia V, Weickert MO, Pfeiffer AFH. Kabisch S, et al. Int J Mol Sci. 2025 Feb 25;26(5):2000. doi: 10.3390/ijms26052000. Int J Mol Sci. 2025. PMID: 40076626 Free PMC article. Review. - The Health Benefits of Dietary Fibre.
Barber TM, Kabisch S, Pfeiffer AFH, Weickert MO. Barber TM, et al. Nutrients. 2020 Oct 21;12(10):3209. doi: 10.3390/nu12103209. Nutrients. 2020. PMID: 33096647 Free PMC article. Review. - Mechanisms of Interactions between Bile Acids and Plant Compounds-A Review.
Naumann S, Haller D, Eisner P, Schweiggert-Weisz U. Naumann S, et al. Int J Mol Sci. 2020 Sep 5;21(18):6495. doi: 10.3390/ijms21186495. Int J Mol Sci. 2020. PMID: 32899482 Free PMC article. Review.
References
Publication types
MeSH terms
Substances
LinkOut - more resources
Full Text Sources
Other Literature Sources
Medical
Research Materials
Miscellaneous


