Over-elongation of centrioles in cancer promotes centriole amplification and chromosome missegregation - PubMed (original) (raw)
doi: 10.1038/s41467-018-03641-x.
Adan Guerrero 2 3, André F Vieira 4 5, Bernardo P de Almeida 6 7, Pedro Machado 2 8, Susana Mendonça 2 4 5, Marta Mesquita 9, Beth Villarreal 10, Irina Fonseca 2, Maria E Francia 2 11, Katharina Dores 2, Nuno P Martins 12, Swadhin C Jana 2, Erin M Tranfield 13, Nuno L Barbosa-Morais 6, Joana Paredes 4 5, David Pellman 14, Susana A Godinho 14 15, Mónica Bettencourt-Dias 16
Affiliations
- PMID: 29593297
- PMCID: PMC5871873
- DOI: 10.1038/s41467-018-03641-x
Over-elongation of centrioles in cancer promotes centriole amplification and chromosome missegregation
Gaëlle Marteil et al. Nat Commun. 2018.
Abstract
Centrosomes are the major microtubule organising centres of animal cells. Deregulation in their number occurs in cancer and was shown to trigger tumorigenesis in mice. However, the incidence, consequence and origins of this abnormality are poorly understood. Here, we screened the NCI-60 panel of human cancer cell lines to systematically analyse centriole number and structure. Our screen shows that centriole amplification is widespread in cancer cell lines and highly prevalent in aggressive breast carcinomas. Moreover, we identify another recurrent feature of cancer cells: centriole size deregulation. Further experiments demonstrate that severe centriole over-elongation can promote amplification through both centriole fragmentation and ectopic procentriole formation. Furthermore, we show that overly long centrioles form over-active centrosomes that nucleate more microtubules, a known cause of invasiveness, and perturb chromosome segregation. Our screen establishes centriole amplification and size deregulation as recurrent features of cancer cells and identifies novel causes and consequences of those abnormalities.
Conflict of interest statement
The authors declare no competing interests.
Figures
Fig. 1
Quantifying centriole number and length in cancer cells. a Screen overview. Step 1 and 2: primary and secondary immunofluorescence screenings of centrioles in the NCI-60 cancer cell lines using centrin (green) and centrin/CP110 (red) as centriolar markers, respectively. For each screening, we visually selected 50 mitotic cells per each of the cell lines and programmed the microscope to automatically acquire images as Z-stack using a ×100 objective. Cells were also stained with DAPI (blue) and α-tubulin antibody (red-primary screening, magenta-secondary screening). Scale bar 5 µm, insets 1 µm. Since centriole dimensions (250 nm width and 400 nm length) are close to the resolution limit of light microscopy, we selected some cell lines with extreme phenotypes for validation and further investigation, using transmission electron microscopy (TEM), scale bar 500 nm. Please note that all the pictures presented are from a non-cancerous cell line, RPE-1, used as a negative control in this study. b Overview of the semi-automatised quantitation of centriole alterations. Briefly, maximum intensity projections, obtained from all the stacks collected per field of view, were created (step 1) and mitotic cells were automatically segmented from a background of interphasic cells using a spatial correlation coefficient based on both DAPI and α-tubulin signals, both of which are brighter in mitotic cells (step 2). Subsequently, centrioles were individually segmented using the centrin staining of each mitotic cell (step 3). In the secondary screening, centrioles were independently identified using both centrin and CP110 staining, and only the structures where these two different markers co-localised were kept for further analysis. Once identified in the 2D projections, all centrioles were segmented in three-dimensions (3D), automatically split into individual centrioles and measured in 3D (steps 4, 5 and 6). The number of centrioles per mitotic cell and their individual lengths were stored, together with a gallery of annotated images (see outputs of steps 2 and 3 for examples). These galleries were verified and manually curated twice (at steps 3 and 5). All remaining steps, from 1 to 6, were automatically performed by the developed algorithm. Scale bar 5 µm, insets 0.5 µm
Fig. 2
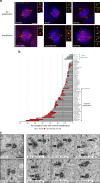
Centriole amplification is widespread in cancer cells. a Immunofluorescence images of cell lines without (upper panel) and with (lower panel) centriole amplification. Cells were stained with DAPI (blue), centrin (green), α-tubulin (red) and CP110 antibodies (red-insets). Scale bar 5 µm, insets 1 µm. Note the presence of centrin dots lacking CP110 staining in the SN12C cell line (upper panel-inset 1). b Output of the secondary immunofluorescence screenings for centriole number in the NCI-60 panel. To validate the primary screening, the top 50% of amplification and a subset of less-defective ones from the primary screening were incorporated in the secondary screening (see text). The results of the secondary screening are depicted in the bar graph in which cell lines were ranked according to their percentage of mitotic cells with more than four centrioles. To define the cut-off for centriole amplification and the variability of centriole number in non-cancerous cell lines, we quantified centriole number in five non-cancerous cell lines (depicted in green): RPE-1 (retinal pigmented epithelial cells), HB2 (mammary luminal epithelial cells), HaCat (keratinocytes), LT97 (colon adenoma cells) and SAEC (small airway epithelial cells). The average percentage of cells with centriole amplification in the non-cancerous cell lines is 7 ± 3%, therefore we set the cut-off for centriole amplification to 13% (average + 2 standard deviations). 28 cell lines from the NCI-60 panel displayed significant centriole amplification. Note that for most of the cell lines, the majority of cells with amplification showed 5 to 8 centrioles per cell (grey). Cells with more than eight centrioles per cell (red) were less commonly observed. A total of 50 to 60 mitotic cells were analysed per cell line. BR breast, CNS central nervous system, CO colon, BL blood, LU lung, PR prostate, KI kidney, OV ovaries and SK skin. c TEM images of control (RPE-1) and SN12C cells with normal number of centrioles (2), and a MDA-MB-435 cell with supernumerary centrioles (8). Each TEM picture represents an individual cell for the control and SN12C cell lines, whereas the remaining pictures are serial sections of the same MDA-MB-435 cell. Scale bar 500 nm
Fig. 3
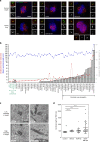
Increase and variability in centriole length are recurrent in cancer cell lines. a Immunofluorescence images of cell lines without (upper panel) and with (lower panel), centriole length deregulation. Cells were stained with DAPI (blue), α-tubulin (red), centrin (green) and CP110 (red-insets) antibodies. Scale bar 5 µm, insets 1 µm. b Output of the secondary screening for centriole length in the NCI-60. To validate the primary screening, the top 50% of over-elongation, and a subset of the less-defective ones, were processed in the secondary screening. The results of the secondary screening are depicted in the bar graph (cell lines are ranked according to their percentage of mitotic cells containing at least one overly long centriole). The mean centriole length (blue) and the variance-to-mean ratio (VMR-red), a normalised measure of the dispersion of the distribution, are depicted for each cell line. The cut-off for centriole over-elongation (in green) was set to 5% which corresponds to the average percentage (1%) of cells with centriole over-elongation in the 5 non-cancerous cell lines plus 2 s.d. (2%). 22 cell lines display significant centriole over-elongation. Centriole length was scored in 3D using centrin staining. From 207 to 388 centrioles were measured per cell line. The magenta asterisks label the cell lines that were selected for analysis by TEM. c TEM images of longitudinal sections of normal-length centrioles (around 500 nm) in the control (RPE-1) and SN12C cell lines, and of overly long centrioles in HOP-62 and MDA-MB-435 cell lines (740 and 1800 nm, respectively). Note the presence of a crack (arrow) in the overly long centriole of MDA-MB-435 cell. Each TEM picture represents an individual cell. Scale bar 500 nm. d Quantification of centriole length, using the Image J software, from TEM images of longitudinal sections of different centrioles for the control (#22, median = 427 nm, VMR = 2.7), SN12C (#20, median = 486 nm, VMR = 4.5), HOP-62 (#25, median = 502 nm, VMR = 51.9) and MDA-MB-435 (#23, median = 546 nm, VMR = 280.3) cell lines. The bar represents the mean ± s.d. ***represents p < 0.001 and ****p < 0.0001 (Mann–Whitney statistical test)
Fig. 4
Basal-like human breast carcinomas display more centriole amplification than luminal breast carcinomas. a Representative immunofluorescence images of sections of human breast tumours showing normal centriole number (2) in interphasic cells of luminal breast carcinoma (upper left panel), and centriole amplification (>4), in both luminal (lower left panel) and basal-like (right panel) breast carcinomas. We labelled centrioles using the centriolar marker GT335, which labels tubulin glutamylation, a modification of tubulin present in centrioles, in co-localisation with the PCM marker, pericentrin. Tissue sections were also stained with DAPI (blue). Please note that we focused our analysis on interphase cells, as it is very difficult to find mitotic figures in breast tumours. Scale bar 5 µm, insets 1 µm. b Percentage of cells displaying centriole amplification in each of the 15 patients with luminal breast carcinomas (average 8% ± 2) and in each of the 10 patients with basal-like carcinomas ((on average 22% ± 2), p = 0.0004, Mann–Whitney test). Please note that only structures positive for both pericentrin and GT335 were taken into consideration to avoid false positives. All basal-like carcinomas (10 out of 10 patients) exhibited centriole amplification while it was not detected in 5 out of the 15 luminal carcinomas. Between 20 and 133 cells were analysed for each patient (see Supplementary Fig. S6). The bar represents the mean ± s.d
Fig. 5
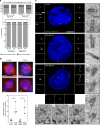
Centriole over-elongation drives centriole amplification in cancer cells via ectopic procentriole formation and centriole fragmentation. a Centriole elongation and amplification are not independent. Higher proportion of overly long centrioles (>500 nm) in cells with centriole amplification (CA), (p < 0.0001, Pearson’s Chi-squared test), compared with the expected proportions under the null hypothesis of independence. The expected and observed percentages of overly long centrioles in cells with no CA and CA are shown, together with a detailed view above, given the low frequency of overly long centrioles. b Induced centriole elongation triggers centriole amplification in cancer cell lines. CPAP was transiently overexpressed for 96 h in two cell lines from the NCI-60 panel, T47D and SF268, which do not normally display centriole over-elongation. Cells were stained with DAPI (blue), alpha-tubulin (a marker of MTs) and centrin (used as a readout for centriole number) antibodies (Scale bar 5 µm). 3 independent experiments performed (depicted with squares, triangles and circles). 80–140 cells were counted per condition and per experiment. The bars represent the means ± s.d. *Represents a p < 0.05 (one-tailed unpaired t test with Welch’s correction). c Centriole fragmentation and ectopic centriole formation in cancer cells with overly long centrioles. Examples of structured Illumination Microscopy (SIM) and TEM pictures showing normal-length centrioles in the control cell line (upper panel), overly long centrioles with defective structures (middle panel), centriolar fragments (lower panel, inset 2 for SIM and insets of Ai, ii, iii for TEM) and ectopic procentrioles along the overly long centrioles (lower panel, labelled by asterisks in inset 3 for SIM and Biii and iv for TEM) in the MDA-MB-435 cell line. For SIM, cells were stained with DAPI (blue), acetylated tubulin (green) and STIL (red) antibodies, and were subjected to a 2 h cold treatment, prior to fixation, to depolymerise the cytoplasmic MTs. For TEM, each picture represents an individual cell except for Ai, ii, iii and Bi, ii, iii and iv, where the pictures are serial sections of the same cell. Scale bar: 5 µm (SIM) or 500 nm (TEM). Insets: 1 µm (SIM) or 250 nm (TEM)
Fig. 6
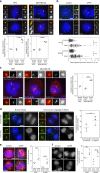
Centriole over-elongation leads to the formation of over-active centrosomes. a, b Overly long centrioles recruit more pericentriolar material than normal-length centrioles. a RPE-1 (control, only normal-length centrioles) and MDA-MB-435 (with normal-length and overly long centrioles) cells were stained with DAPI (blue), centrin (green), and γ-tubulin or pericentrin, (PCM components, red) antibodies (for details see Supplementary Fig. 11a and methods). 3 independent experiments performed (squares, triangles, circles). A total of 37–62 centrosomes quantified per condition and per experiment. One-tailed unpaired t test with Welch’s correction. b Induced centriole elongation triggers enhanced PCM recruitment. CPAP was overexpressed for 48 h in two NCI-60 cell lines, T47D and SF268, which do not display overly long centrioles. Cells were stained with DAPI (blue), pericentrin (red) and acetylated tubulin (green) antibodies. Compilation of three experiments (around 30 centrosomes accounted per condition and per experiment). Mann–Whitney test. c Overly long centrioles nucleate more MTs than normal-length centrioles. Microtubule regrowth assay in RPE-1 and MDA-MB-435 cell line. Cells were stained with DAPI (blue), α-tubulin (red) and centrin (green) antibodies (see Supplementary Fig. 11d and methods). Three independent experiments performed (squares, triangles, circles). A total of 30–82 centrosomes accounted per condition and per experiment. One-tailed unpaired t test with Welch’s correction. d Chromosome segregation defects (see Supplementary Fig. 12a, b) are increased in mitotic cells with overly long centrioles. MDA-MB-435 cells were stained with DAPI (blue), CENPB (centromere, green), centrin (green) and CP110 (red, CP110 antibody sometimes labels the midbody) antibodies. (200 cells counted per experiment, n = 3 squares, triangles, circles). z score test. e, f Induced centriole elongation enhances multipolar mitosis formation and chromosome segregation defects (for details see Supplementary Fig. 12). CPAP was transiently overexpressed for 96 h in T47D and SF268 cell lines. Cells were stained with DAPI (blue), α-tubulin (red) and centrin (green) antibodies. Three independent experiments performed (squares, triangles, circles). Between 30–87 mitosis for e and 38–55 for f accounted per condition and per experiment. z score test, one-tailed. For all images: scale bar: 5 µm, insets: 1 µm (except for b, insets: 2 µm). For all graphs, the bars represent the means ± s.d. For all tests, **p ≤ 0.01 and ***p ≤ 0.001 and ****p ≤ 0.0001
Fig. 7
Cellular consequences of centriole length deregulation. In cancer cells, over elongated centrioles induce centriole amplification through centriole fragmentation and/or ectopic procentriole formation along the elongated centrioles. Elongated centrioles also generate larger MTOCs with a higher capacity to nucleate MTs that enhance chromosome instability during mitosis. Both scenarios could give rise to aneuploidy and might as well induce invasiveness, therefore centriole length deregulation might participate to tumour initiation and progression
Similar articles
- Daughter centriole elongation is controlled by proteolysis.
Korzeniewski N, Cuevas R, Duensing A, Duensing S. Korzeniewski N, et al. Mol Biol Cell. 2010 Nov 15;21(22):3942-51. doi: 10.1091/mbc.E09-12-1049. Epub 2010 Sep 22. Mol Biol Cell. 2010. PMID: 20861314 Free PMC article. - Role of Polo-like Kinases Plk1 and Plk4 in the Initiation of Centriole Duplication-Impact on Cancer.
Hoffmann I. Hoffmann I. Cells. 2022 Feb 24;11(5):786. doi: 10.3390/cells11050786. Cells. 2022. PMID: 35269408 Free PMC article. Review. - A Short CEP135 Splice Isoform Controls Centriole Duplication.
Dahl KD, Sankaran DG, Bayless BA, Pinter ME, Galati DF, Heasley LR, Giddings TH Jr, Pearson CG. Dahl KD, et al. Curr Biol. 2015 Oct 5;25(19):2591-6. doi: 10.1016/j.cub.2015.08.039. Epub 2015 Sep 24. Curr Biol. 2015. PMID: 26412126 Free PMC article. - Asymmetric Centriole Numbers at Spindle Poles Cause Chromosome Missegregation in Cancer.
Cosenza MR, Cazzola A, Rossberg A, Schieber NL, Konotop G, Bausch E, Slynko A, Holland-Letz T, Raab MS, Dubash T, Glimm H, Poppelreuther S, Herold-Mende C, Schwab Y, Krämer A. Cosenza MR, et al. Cell Rep. 2017 Aug 22;20(8):1906-1920. doi: 10.1016/j.celrep.2017.08.005. Cell Rep. 2017. PMID: 28834753 - Deregulation of the centrosome cycle and the origin of chromosomal instability in cancer.
Lingle WL, Lukasiewicz K, Salisbury JL. Lingle WL, et al. Adv Exp Med Biol. 2005;570:393-421. doi: 10.1007/1-4020-3764-3_14. Adv Exp Med Biol. 2005. PMID: 18727509 Review.
Cited by
- Inhibiting centrosome clustering reduces cystogenesis and improves kidney function in autosomal dominant polycystic kidney disease.
Cheng T, Mariappan A, Langner E, Shim K, Gopalakrishnan J, Mahjoub MR. Cheng T, et al. JCI Insight. 2024 Feb 22;9(4):e172047. doi: 10.1172/jci.insight.172047. JCI Insight. 2024. PMID: 38385746 Free PMC article. - Chromosomal Instability as Enabling Feature and Central Hallmark of Breast Cancer.
Castellanos G, Valbuena DS, Pérez E, Villegas VE, Rondón-Lagos M. Castellanos G, et al. Breast Cancer (Dove Med Press). 2023 Mar 9;15:189-211. doi: 10.2147/BCTT.S383759. eCollection 2023. Breast Cancer (Dove Med Press). 2023. PMID: 36923397 Free PMC article. Review. - Identification of a Synergistic Multi-Drug Combination Active in Cancer Cells via the Prevention of Spindle Pole Clustering.
Weiss A, Le Roux-Bourdieu M, Zoetemelk M, Ramzy GM, Rausch M, Harry D, Miljkovic-Licina M, Falamaki K, Wehrle-Haller B, Meraldi P, Nowak-Sliwinska P. Weiss A, et al. Cancers (Basel). 2019 Oct 22;11(10):1612. doi: 10.3390/cancers11101612. Cancers (Basel). 2019. PMID: 31652588 Free PMC article. - Targeting the cell cycle in breast cancer: towards the next phase.
Thu KL, Soria-Bretones I, Mak TW, Cescon DW. Thu KL, et al. Cell Cycle. 2018;17(15):1871-1885. doi: 10.1080/15384101.2018.1502567. Epub 2018 Sep 11. Cell Cycle. 2018. PMID: 30078354 Free PMC article. Review. - Pan-cancer association of a centrosome amplification gene expression signature with genomic alterations and clinical outcome.
de Almeida BP, Vieira AF, Paredes J, Bettencourt-Dias M, Barbosa-Morais NL. de Almeida BP, et al. PLoS Comput Biol. 2019 Mar 11;15(3):e1006832. doi: 10.1371/journal.pcbi.1006832. eCollection 2019 Mar. PLoS Comput Biol. 2019. PMID: 30856170 Free PMC article.
References
Publication types
MeSH terms
Substances
LinkOut - more resources
Full Text Sources
Other Literature Sources
Research Materials
Miscellaneous


