Nuclear-Import Receptors Reverse Aberrant Phase Transitions of RNA-Binding Proteins with Prion-like Domains - PubMed (original) (raw)
. 2018 Apr 19;173(3):677-692.e20.
doi: 10.1016/j.cell.2018.03.002.
Hong Joo Kim 2, Hejia Wang 1, John Monaghan 3, Fernande Freyermuth 4, Julie C Sung 1, Kevin O'Donovan 2, Charlotte M Fare 1, Zamia Diaz 1, Nikita Singh 1, Zi Chao Zhang 5, Maura Coughlin 2, Elizabeth A Sweeny 1, Morgan E DeSantis 1, Meredith E Jackrel 1, Christopher B Rodell 6, Jason A Burdick 6, Oliver D King 7, Aaron D Gitler 8, Clotilde Lagier-Tourenne 4, Udai Bhan Pandey 3, Yuh Min Chook 9, J Paul Taylor 10, James Shorter 11
Affiliations
- PMID: 29677512
- PMCID: PMC5911940
- DOI: 10.1016/j.cell.2018.03.002
Nuclear-Import Receptors Reverse Aberrant Phase Transitions of RNA-Binding Proteins with Prion-like Domains
Lin Guo et al. Cell. 2018.
Abstract
RNA-binding proteins (RBPs) with prion-like domains (PrLDs) phase transition to functional liquids, which can mature into aberrant hydrogels composed of pathological fibrils that underpin fatal neurodegenerative disorders. Several nuclear RBPs with PrLDs, including TDP-43, FUS, hnRNPA1, and hnRNPA2, mislocalize to cytoplasmic inclusions in neurodegenerative disorders, and mutations in their PrLDs can accelerate fibrillization and cause disease. Here, we establish that nuclear-import receptors (NIRs) specifically chaperone and potently disaggregate wild-type and disease-linked RBPs bearing a NLS. Karyopherin-β2 (also called Transportin-1) engages PY-NLSs to inhibit and reverse FUS, TAF15, EWSR1, hnRNPA1, and hnRNPA2 fibrillization, whereas Importin-α plus Karyopherin-β1 prevent and reverse TDP-43 fibrillization. Remarkably, Karyopherin-β2 dissolves phase-separated liquids and aberrant fibrillar hydrogels formed by FUS and hnRNPA1. In vivo, Karyopherin-β2 prevents RBPs with PY-NLSs accumulating in stress granules, restores nuclear RBP localization and function, and rescues degeneration caused by disease-linked FUS and hnRNPA2. Thus, NIRs therapeutically restore RBP homeostasis and mitigate neurodegeneration.
Keywords: ALS; FTD; FUS; Karyopherin-β2; Nuclear-important receptor; TDP-43; disaggregase; hnRNPA1; neurodegeneration; phase transition.
Copyright © 2018 Elsevier Inc. All rights reserved.
Conflict of interest statement
Declaration of Interests
The authors have no competing interests.
Figures
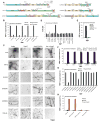
Figure 1. Kapβ2 is a molecular chaperone for diverse RBPs with a PY-NLS
(A) Domain architecture of FUS, TAF15, EWSR1, hnRNPA1, hnRNPA2 and TDP-43. Disease-linked mutations used in this study and domains are indicated: PrLD (blue), Gly-rich domain (mauve), RRM (yellow), RGG (green), Zinc finger (grey) and NLS (salmon). (B) FUS, FUSΔNLS, TAF15, TAF15ΔNLS, EWSR1, EWSR1ΔNLS, hnRNPA1, hnRNPA1ΔNLS, hnRNPA2 or hnRNPA2ΔNLS (5μM) were incubated with buffer, Kapβ2 (5μM), Kapβ2W460A:W730A (5μM) or Impα (5μM) plus Kapβ1 (5μM). Fibrillization was assessed by sedimentation. Values are means±SEM (n=3). (C) Fibrillization reactions performed as in (B) and processed for EM. Arrows denote fibrils. Bar, 0.5μm. (D) Kapβ2 IC50s for fibrillization of indicated RBPs (5μM) performed as in (B). IC50 for FUSR495X could not be determined and is greater than 20μM. (E) FUS (5μM) was incubated with buffer, Kapβ2 (5μM), HDAC1 (5μM or 50μM) or anti-FUS antibody (5μM). Fibrillization was assessed by sedimentation. Values are means±SEM (n=3). (F) FUS, TAF15, EWSR1, hnRNPA1 or hnRNPA2 (5μM) were incubated as in (B) in the absence or presence of Kapβ2 (5μM) plus or minus RanGDP or RanGTP (25μM). Fibrillization was assessed by sedimentation. Values are means±SEM (n=3). (G) FUSR234L, FUSR495X, FUSH517Q, FUSR521C, FUSR521H, FUSP525L, TAF15G391E, TAF15R408C, EWSR1G511A, EWSR1P552L, hnRNPA1D262V, hnRNPA1D262N or hnRNPA2D290V (5μM) were incubated as in (B) with buffer, Kapβ2 (5μM) or Kapβ2W460A:W730A (5μM). Fibrillization was assessed by sedimentation. Values are means±SEM (n=3). (H) TDP-43, TDP-43Q331K, TDP-43188-414 or TDP-43ΔNLS (5μM) were incubated with buffer Kapβ2 (5μM) or Impα (5μM) plus Kapβ1 (5μM). Fibrillization was assessed by sedimentation. Values are means±SEM (n=3). See also Figure S1.
Figure 2. Kapβ2 inhibits seeded fibrillization of diverse RBPs with a PY-NLS
(A) FUS (5μM) plus or minus FUS fibrils (5% wt/wt), (B) TAF15 (5μM) plus or minus TAF15 fibrils (5% wt/wt), (C) EWSR1 (5μM) plus or minus EWSR1 fibrils (5% wt/wt), (D) hnRNPA1 (5μM) plus or minus hnRNPA1 fibrils (5% wt/wt), (E) hnRNPA2 (5μM) plus or minus hnRNPA2 fibrils (5% wt/wt) or (F) TDP-43 (5μM) plus or minus TDP-43 fibrils (5% wt/wt) was incubated with buffer, Kapβ2 (5μM), Kapβ2W460A:W730A (5μM) or Impα (5μM) plus Kapβ1 (5μM). Fibrillization was assessed by sedimentation. Values are means±SEM (n=3). (G) FUS (5μM) was incubated with FUS fibrils (5% wt/wt) with or without Kapβ2 (5μM) and processed for EM. Bar, 10μm. (H) Disease-linked RBP (5μM) plus or minus fibrils of the same disease-linked RBP (5% wt/wt) was incubated with buffer, Kapβ2 (5μM) or Impα (5μM) plus Kapβ1 (5μM). Fibrillization was assessed by sedimentation. Values are means±SEM (n=3). See also Figure S2.
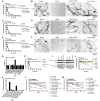
Figure 3. Kapβ2 disaggregates fibrils formed by diverse RBPs with a PY-NLS
(A-F) FUS (A, B), TAF15 (C, D) or EWSR1 (E, F) fibrils (5μM monomer) were incubated with buffer, Kapβ2 (5μM), Kapβ2W460A:W730A (5μM) or Impα (5μM) plus Kapβ1 (5μM) in the absence or presence of RanGDP or RanGTP (25μM). Disaggregation was assessed by turbidity (A, C, E). Values are means±SEM (n=3). Disaggregation was also assessed by EM (B, D, F). Bar, 0.5μm. (G) Kapβ2 EC50s for disaggregation of indicated RBP (5μM monomer) performed as in (A). EC50 for FUSR495X could not be determined and is greater than 20μM. (H) FUS fibrils (5μM monomer) were incubated with Kapβ2 (5μM), HDAC1 (5 or 50μM) or anti-FUS antibody (5μM). Disaggregation was assessed by turbidity. Values are means±SEM (n=3). (I) His-FUS fibrils (5μM monomer) were disassembled with bio-Kapβ2 (5μM). Soluble disaggregation products were recovered and incubated with RanGDP or RanGTP (25μM). Kapβ2 was depleted with Neutravidin sepharose or His-FUS was depleted with Ni-NTA. Input, bound, and unbound fractions were processed for immunoblot. (J) TDP-43 fibrils (5μM monomer) were incubated with Kapβ2 (5μM), Impα (5μM) plus Kapβ1 (5μM), Hsp104 (5μM) plus Sse1 (1μ), Ssa1 (1μM) and Ydj1 (1μM), Hsp104A503S (5μM) plus Sse1 (1μM), Ssa1 (1μM) and Ydj1 (1μM), or Hsp110 (Apg2; 5μM), Hsp70 (Hsc70; 5μM) and Hsp40 (Hdj1; 5μM). Disaggregation was assessed by turbidity. Values are means±SEM (n=3). (K) RBP fibrils (5μM monomer) were incubated with buffer or Kapβ2 (5μM). Disaggregation was assessed by turbidity. Values are means±SEM (n=3). (L) hnRNPA1, hnRNPA1D262V, hnRNPA1D262N or hnRNPA1ΔNLS fibrils (5μM monomer) were incubated with Kapβ2 (5μM), Kapβ2W460A:W730A (5μM), Hsp104 (5μM) plus Sse1 (1μM), Ssa1 (1μM) and Ydj1 (1μM), Hsp104A503S (5μM) plus Sse1 (1μM), Ssa1 (1μM) and Ydj1 (1μM), or Hsp110 (Apg2; 5μM), Hsp70 (Hsc70; 5μM) and Hsp40 (Hdj1; 5μM). Disaggregation was assessed by sedimentation. Values are means±SEM (n=3). (M) hnRNPA2, hnRNPA2D290V or hnRNPA2ΔNLS fibrils (5μM monomer) were incubated with Kapβ2 (5μM), Kapβ2W460A:W730A (5μM), Hsp104 (5μM) plus Sse1 (1μM), Ssa1 (1μM) and Ydj1 (1μM), Hsp104A503S (5μM) plus Sse1 (1μM), Ssa1 (1μM) and Ydj1 (1μM), or Hsp110 (Apg2; 5μM), Hsp70 (Hsc70; 5μM) and Hsp40 (Hdj1; 5μM). Disaggregation was assessed by sedimentation. Values are means±SEM (n=3). See also Figure S3.
Figure 4. Kapβ2 dissolves FUS and hnRNPA1 hydrogels
(A) Macroscopic hydrogel formed by FUS (240μM). Bar, 1mm. (B) EM of FUS hydrogel treated with buffer reveals a fibrillary network that is disrupted by Kapβ2. Molar ratio of Kapβ2:FUS=0.675. Bar, 0.1μm. (C, D) Storage modulus (C) and loss modulus (D) of FUS hydrogels treated with buffer or Kapβ2. Molar ratio of Kapβ2:FUS=0.675. Values are means±SEM. (E, F) Storage modulus (E) and loss modulus (F) of FUS hydrogels treated with buffer or Kapβ2W460A:W730A. Molar ratio of KapβW460A:W730A:FUS=0.415. Values are means±SEM. (G) FUS hydrogels were treated with buffer, Kapβ2 or Kapβ2W460A:W730A. Molar ratio of Kapβ/KapβW460A:W730A:FUS=0.563. (H) FUS1-214 hydrogels were treated with Kapβ2. Molar ratio of Kapβ2:FUS1-214=0.15. (I) Macroscopic hydrogel formed by hnRNPA1 (3.1mM). Bar, 1mm. (J) EM of solid-like hnRNPA1 gels treated with buffer reveals fibrillar network (left) that is disrupted by Kapβ2 (right). Molar ratio of Kapβ:hnRNPA1=0.13. Bar, 0.5μm. (K, L) Storage modulus (K) and loss modulus (L) of hnRNPA1 gels treated with buffer, Kapβ2 or Kapβ2W460A:W730A. Molar ratio of Kapβ2:hnRNPA1=0.13. Values are means±SEM. (M) Solid-like hnRNPA1 gels were treated with Kapβ2. Note partial disassembly of hnRNPA1 hydrogel by Kapβ2 over time (indicated by the bracket). Molar ratio of Kapβ2:hnRNPA1=0.13. (N, O) Storage modulus (N) and loss modulus (O) of hnRNPA1 gels treated with buffer or GFP. Molar ratio of GFP:hnRNPA1=0.27. Values are means±SEM. (P, Q) Storage modulus (P) and loss modulus (Q) of hnRNPA1D262V gels treated with buffer or Kapβ2. Molar ratio of Kapβ:hnRNPA1D262V=0.76. Values are means±SEM. (R, S) Storage modulus (R) and loss modulus (S) of hnRNPA1G274A:P288A:Y289A gels treated with buffer or Kapβ2. Molar ratio of Kapβ:hnRNPA1G274A:P288A:Y289A=0.13. Values are means±SEM. See also Figure S4 and Movies S1-S4.
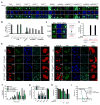
Figure 5. Kapβ2 antagonizes RBP phase transitions and toxicity in vivo
(A, B) Fluorescence microscopy of yeast expressing indicated GFP-tagged RBP and Kapβ2 or vector control. Hoechst staining marks nuclei (blue). Bar, 2μm. The percentage of cells with RBP in the nucleus and lacking cytoplasmic RBP foci is shown (B). Values are means±SEM (n=3). (C) Fluorescence microscopy of yeast expressing GFP-FUS from the copper promoter for 2h (upper panel) that were shifted to galactose media without copper for 3h to induce Kapβ2 or Kapβ2W460A:W730A and switch off FUS (lower two panels). Hoechst staining marks nuclei (blue). (D) Quantification of (C) and an additional condition where GFP-FUS was expressed from the copper promoter for the first 2h and then Kapβ2 or Kapβ2W460A:W730 expression was induced for 3h without switching off FUS. The percentage of cells with FUS in the nucleus and lacking cytoplasmic FUS foci is shown. Values are means±SEM (n=3). (E) HeLa cells were transfected with HA-FUS plus GFP, GFP-Kapβ2, GFP-Kapβ2W460A:W730 or GFP-Kapβ2TL. Cells were treated with 0.5mM sodium arsenite for 60min, and immunostained with anti-HA, anti-G3BP1 and DAPI. Yellow arrows denote FUS-positive SGs. Cells at pre- (Ars) and 60min post-arsenite treatment (+Ars) are shown. White arrowheads denote FUS-positive SGs in cells that do not express GFP-Kapβ2WT or GFP-Kapβ2TL. Bar, 10μm (F) Quantification of (E). The percentage of transfected cells with FUS-positive SGs is shown. ***p<0.001 two-way ANOVA, Bonferroni’s multiple comparisons test, n=3-4 biological repeats. Values are means±SEM (n=3-4). (G) HeLa cells were transfected with GFP or GFP-Kapβ2 together with HA-FUSR518K, HA-FUSR521C, HA-FUSR521H or HA-FUSΔNLS. Cells were fixed and immunostained as in (E). The percentage of transfected cells with FUS-positive SGs is shown. **p<0.01, ***p<0.001 by two-way ANOVA, Bonferroni’s multiple comparisons test, n=6 biological repeats. Values are means±SEM (n=6). (H) Kapβ2 but not Kapβ2W460A:W730A suppressed FUS and FUSR521H toxicity in HEK293T cells. Cell viability was assessed by MTT assay. Values are means±SEM (n=7). One-way ANOVA with post-hoc Dunnett’s multiple comparisons test was used to compare the control (grey) to other conditions (**** denotes p≤0.0001). (I) Kapβ2 but not GFP mitigates shortened lifespan of flies expressing FUSR521H in motor neurons. A Log Rank Test for Trend was used to test for differences between survival curves and a Log Rank Mantel Cox Test for pairwise comparisons between FUSR521H versus FUSR521H plus Kapβ2 and FUSR521H plus GFP versus FUSR521H plus Kapβ2. All revealed significant differences with p<0.001. See also Figure S5, S6 and S7.
Figure 6. Kapβ2 reduces hnRNPA1 and hnRNPA2 accumulation in SGs
(A) HeLa cells were transfected with GFP or GFP-Kapβ2 together with Flag-hnRNPA1. Cells were treated with 0.5mM sodium arsenite, and immunostained with anti-Flag, anti-eIF4G and DAPI. Arrows indicate hnRNPA1-positive SGs. Cells at pre- (-Ars) and 60min post-arsenite treatment (+Ars) are shown. Scale bar: 10μm. (B) Quantification of (A). The percentage of transfected cells with hnRNPA1-positive SGs is shown. ***p<0.001 by two-way ANOVA, Bonferroni’s multiple comparisons test, n=3 biological repeats. Values are means±SEM (n=3). (C) HeLa cells were transfected with GFP or GFP-Kapβ2 together with Flag-hnRNPA2. Cells were treated with 0.5mM sodium arsenite, and immunostained with anti-Flag, anti-eIF4G and DAPI. Arrows indicate hnRNPA2-positive SGs. (D) Quantification of (C). The percentage of transfected cells with hnRNPA1-positive SGs is shown. ***p<0.001 by two-way ANOVA, Bonferroni’s multiple comparisons test, n=3 biological repeats. Values are means±SEM (n=3).
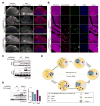
Figure 7. Kapβ2 reduces hnRNPA2D290V aggregation and toxicity in vivo
(A) Adult flies were dissected to expose the dorsal longitudinal indirect flight muscle and stained with Texas Red-phalloidin (red) to label F-actin in muscle fibers and DAPI (blue) to mark nuclei. Flies expressing hnRNPA2 under control of the MHC-Gal4 driver showed mild degeneration indicated by partial wasting of muscle fibers (white arrows). hnRNPA2D290V caused severe muscle degeneration indicated by shrinking and loss of muscle fibers (white arrows). Muscle degeneration was rescued by Kapβ2 and resulted in muscles that were similar to non-transgenic (NTG) controls. Bar, 0.2mm. (B) hnRNPA2 localizes to nuclei, whereas hnRNPA2D290V accumulates in cytoplasmic inclusions (white arrows). hnRNPA2D290V is excluded from the nucleus (yellow arrowhead). Kapβ2 reduces cytoplasmic aggregation and restores hnRNPA2D290V to the nucleus. Bar, 20μm. (C) Thoraces of adult flies were dissected and sequentially extracted to examine hnRNPA2 solubility. Actin serves as a loading control. (D) Thoraces of adult flies were processed for immunoblot with antibodies against GFP and hnRNPA2. Actin serves as a loading control. Quantification of hnRNPA2 levels is shown. Values are means±SD (n=2). (E) In ALS/FTD, nuclear RBPs with PrLDs mislocalize to the cytoplasm and upon stress localize to SGs where they undergo aberrant phase transitions to pathological fibrils. Upregulating Kapβ2 reverses aberrant phase transitions and solubilizes aggregated RBPs. Once solubilized, Kapβ2 transports RBPs back to the nucleus where RanGTP dissociates Kapβ2:RBP complexes enabling RBPs to perform nuclear functions and Kapβ2 to be recycled to catalyze further rounds of disaggregation. See also Figure S7.
Similar articles
- Therapeutic Dissolution of Aberrant Phases by Nuclear-Import Receptors.
Guo L, Fare CM, Shorter J. Guo L, et al. Trends Cell Biol. 2019 Apr;29(4):308-322. doi: 10.1016/j.tcb.2018.12.004. Epub 2019 Jan 16. Trends Cell Biol. 2019. PMID: 30660504 Free PMC article. Review. - RNA-binding proteins with prion-like domains in health and disease.
Harrison AF, Shorter J. Harrison AF, et al. Biochem J. 2017 Apr 7;474(8):1417-1438. doi: 10.1042/BCJ20160499. Biochem J. 2017. PMID: 28389532 Free PMC article. Review. - Nuclear-Import Receptors Counter Deleterious Phase Transitions in Neurodegenerative Disease.
Odeh HM, Fare CM, Shorter J. Odeh HM, et al. J Mol Biol. 2022 Jan 15;434(1):167220. doi: 10.1016/j.jmb.2021.167220. Epub 2021 Aug 28. J Mol Biol. 2022. PMID: 34464655 Free PMC article. Review. - Phase Separation of FUS Is Suppressed by Its Nuclear Import Receptor and Arginine Methylation.
Hofweber M, Hutten S, Bourgeois B, Spreitzer E, Niedner-Boblenz A, Schifferer M, Ruepp MD, Simons M, Niessing D, Madl T, Dormann D. Hofweber M, et al. Cell. 2018 Apr 19;173(3):706-719.e13. doi: 10.1016/j.cell.2018.03.004. Cell. 2018. PMID: 29677514 - A minimal construct of nuclear-import receptor Karyopherin-β2 defines the regions critical for chaperone and disaggregation activity.
Fare CM, Rhine K, Lam A, Myong S, Shorter J. Fare CM, et al. J Biol Chem. 2023 Feb;299(2):102806. doi: 10.1016/j.jbc.2022.102806. Epub 2022 Dec 15. J Biol Chem. 2023. PMID: 36529289 Free PMC article.
Cited by
- Phase separation in immune regulation and immune-related diseases.
Huang N, Dong H, Shao B. Huang N, et al. J Mol Med (Berl). 2022 Oct;100(10):1427-1440. doi: 10.1007/s00109-022-02253-9. Epub 2022 Sep 9. J Mol Med (Berl). 2022. PMID: 36085373 Free PMC article. Review. - Biomolecular Condensates: Sequence Determinants of Phase Separation, Microstructural Organization, Enzymatic Activity, and Material Properties.
Schuster BS, Regy RM, Dolan EM, Kanchi Ranganath A, Jovic N, Khare SD, Shi Z, Mittal J. Schuster BS, et al. J Phys Chem B. 2021 Apr 15;125(14):3441-3451. doi: 10.1021/acs.jpcb.0c11606. Epub 2021 Mar 4. J Phys Chem B. 2021. PMID: 33661634 Free PMC article. - Surface tension and viscosity of protein condensates quantified by micropipette aspiration.
Wang H, Kelley FM, Milovanovic D, Schuster BS, Shi Z. Wang H, et al. Biophys Rep (N Y). 2021 Sep 8;1(1):100011. doi: 10.1016/j.bpr.2021.100011. Epub 2021 Aug 11. Biophys Rep (N Y). 2021. PMID: 36247368 Free PMC article. - Defining the role of the polyasparagine repeat domain of the S. cerevisiae transcription factor Azf1p.
Stewart T, Wolfe BE, Fuchs SM. Stewart T, et al. PLoS One. 2021 May 21;16(5):e0247285. doi: 10.1371/journal.pone.0247285. eCollection 2021. PLoS One. 2021. PMID: 34019539 Free PMC article. - Importin α/β and the tug of war to keep TDP-43 in solution: quo vadis?
Doll SG, Cingolani G. Doll SG, et al. Bioessays. 2022 Dec;44(12):e2200181. doi: 10.1002/bies.202200181. Epub 2022 Oct 17. Bioessays. 2022. PMID: 36253101 Free PMC article. Review.
References
- Chook YM, Jung A, Rosen MK, Blobel G. Uncoupling Kapbeta2 substrate dissociation and ran binding. Biochemistry. 2002;41:6955–6966. - PubMed
Publication types
MeSH terms
Substances
Grants and funding
- T32 GM133398/GM/NIGMS NIH HHS/United States
- HHMI/Howard Hughes Medical Institute/United States
- F31 NS079009/NS/NINDS NIH HHS/United States
- R35 NS097974/NS/NINDS NIH HHS/United States
- R01 GM099836/GM/NIGMS NIH HHS/United States
- R35 NS097263/NS/NINDS NIH HHS/United States
- R01 GM069909/GM/NIGMS NIH HHS/United States
- R21 NS090205/NS/NINDS NIH HHS/United States
- R21 NS094921/NS/NINDS NIH HHS/United States
- T32 CA079443/CA/NCI NIH HHS/United States
- R01 NS081303/NS/NINDS NIH HHS/United States
- R21 NS100055/NS/NINDS NIH HHS/United States
- R01 NS087227/NS/NINDS NIH HHS/United States
- T32 GM008275/GM/NIGMS NIH HHS/United States
- T32 GM071339/GM/NIGMS NIH HHS/United States
LinkOut - more resources
Full Text Sources
Other Literature Sources
Molecular Biology Databases
Research Materials
Miscellaneous


