Structural and functional analysis of mRNA export regulation by the nuclear pore complex - PubMed (original) (raw)
Structural and functional analysis of mRNA export regulation by the nuclear pore complex
Daniel H Lin et al. Nat Commun. 2018.
Abstract
The nuclear pore complex (NPC) controls the passage of macromolecules between the nucleus and cytoplasm, but how the NPC directly participates in macromolecular transport remains poorly understood. In the final step of mRNA export, the DEAD-box helicase DDX19 is activated by the nucleoporins Gle1, Nup214, and Nup42 to remove Nxf1•Nxt1 from mRNAs. Here, we report crystal structures of Gle1•Nup42 from three organisms that reveal an evolutionarily conserved binding mode. Biochemical reconstitution of the DDX19 ATPase cycle establishes that human DDX19 activation does not require IP6, unlike its fungal homologs, and that Gle1 stability affects DDX19 activation. Mutations linked to motor neuron diseases cause decreased Gle1 thermostability, implicating nucleoporin misfolding as a disease determinant. Crystal structures of human Gle1•Nup42•DDX19 reveal the structural rearrangements in DDX19 from an auto-inhibited to an RNA-binding competent state. Together, our results provide the foundation for further mechanistic analyses of mRNA export in humans.
Conflict of interest statement
The authors declare no competing interests.
Figures
Fig. 1
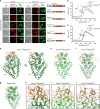
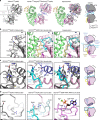
Gle1 is anchored to the nuclear pore complex through a competitive interaction with Nup98. a Cartoon schematic of the human nuclear pore complex (NPC). The circle highlights the region of the NPC to which the proteins used in this study localize. b Domain schematics for nucleoporins used in this study. Protein names and boundaries correspond to the human proteins. c Size exclusion chromatography (SEC) analysis of the interaction between Nup155CTD, SUMO-Gle1N, and Nup98∆FG. Purified Nup155CTD•SUMO-Gle1N complex was mixed with the indicated amounts of Nup98∆FG and loaded onto a Superdex 200 10/300 GL column. The gray bar indicates the fractions visualized with Coomassie-stained SDS-PAGE gels. d Left: table summarizing SEC analysis of Nup155CTD variants for Nup98∆FG and SUMO-Gle1N binding. See also Supplementary Fig. 2. Right: the homologous positions were colored on the C. thermophilum Nup170•Nup145N structure (
PDB ID 5HB0
), indicating that the same binding surface is recognized by Nup98∆FG and SUMO-Gle1N[2]. e Summary of the effect of Gle1N alanine substitution variants on Nup155CTD binding. Colored dots above the sequence of Gle1N indicate the effect of the substitution, green for wild-type levels of complex formation, orange for reduced binding, or red for complete disruption. See also Supplementary Fig. 2. f Identification of the Gle1 binding site suggests that the unassigned cytoplasmic density adjacent to bridging Nup155 molecules could contain Gle1 and its binding partners. Left: surface representation of the composite structure of the NPC. Right: zoomed view of unassigned cytoplasmic density, with Nup155 shown in orange, Gle1N binding site colored in green, and coat nucleoporin complexes shown in yellow
Fig. 2
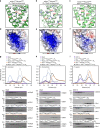
A conserved mechanism for Gle1•Nup42 complex formation. a In vivo localization analysis of Gle1-GFP and Nup42-mCherry-HA variants in nup42∆/gle1-GFP S. cerevisiae cells. Scale bar is 5 μm. Schematics on the right indicate the Nup42 fragments that were included in the construct, with omitted fragments indicated by replacement of the domain with a solid line. Residue numbers indicate the fragment included in each construct. See also Supplementary Fig. 3. b, c Differential scanning fluorimetry analysis of b S. cerevisiae or c H. sapiens Gle1CTD thermostability in the presence and absence of Nup42GBM and IP6. Exposure of hydrophobic residues was monitored by an increase in relative fluorescence units (RFUs). Curves represent the average of three experiments. See also Supplementary Fig. 4. d−f Crystal structures of d S. cerevisiae, e H. sapiens, or f C. thermophilum Gle1CTD•Nup42GBM. See also Supplementary Figs. 5 and 8–11. g Superposition of the structures of S. cerevisiae, H. sapiens, and C. thermophilum Gle1CTD•Nup42GBM, with same coloring as in d−f. See also Supplementary Movie 1. h−j Zoom views of h S. cerevisiae, i H. sapiens, or j C. thermophilum Gle1CTD•Nup42GBM interactions with residues mediating the interaction labeled
Fig. 3
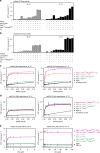
Human Gle1CTD binding to DDX19 is IP6 independent. a−c Zoom view of the IP6 binding pocket of a S. cerevisiae, b C. thermophilum, or c H. sapiens Gle1CTD. Residues that are conserved in fungi but not metazoans are highlighted in red. See also Supplementary Figs. 7 and 12. d−f Surface electrostatic potential analysis of IP6 binding pockets for d S. cerevisiae, e C. thermophilum, or f H. sapiens Gle1. The same view as a−c is shown in surface representation colored by electrostatic potential, from red (−10 kBT/e) to white (0 kBT/e) to blue (+10 kBT/e), revealing a dramatically reduced electrostatic potential for human Gle1CTD. See also Supplementary Figs. 5, 10, and 11. g−i SEC analysis of the interaction between Dbp5/DDX19 and Gle1CTD•Nup42GBM for g S. cerevisiae, h C. thermophilum, or i H. sapiens, in the presence or absence of IP6. The elution profiles for Dbp5/DDX19 are shown in purple, Gle1CTD•Nup42GBM and IP6 are shown in gray, Gle1CTD•Nup42GBM without IP6 are shown in orange, Dbp5/DDX19 with Gle1CTD•Nup42GBM and IP6 are shown in light blue, and Dbp5/DDX19 with Gle1CTD•Nup42GBM without IP6 are shown in black. Fungal Gle1CTD•Nup42GBM interacts strongly with the Superdex matrix in the absence of IP6. The gray horizontal bar indicates fractions visualized with Coomassie-stained SDS-PAGE gels shown below
Fig. 4
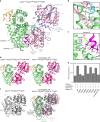
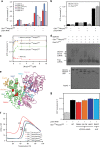
Role of Nup42, RNA, and IP6 in Dbp5/DDX19 activation. a Steady-state colorimetric ATPase assay with S. cerevisiae Dbp5 performed at 30 and 37 °C with either purified S. cerevisiae Gle1CTD or Gle1CTD•Nup42GBM. Reactions were performed with 0.5 μM Dbp5, 1.0 μM Gle1CTD or Gle1CTD•Nup42GBM, 0.1 mg/ml polyA RNA, and 2.0 μM IP6. Values shown are the average of three experiments. Error bars indicate the standard deviation. See also Supplementary Fig. 13. b Steady-state colorimetric ATPase assay with H. sapiens DDX19 performed at 30 and 37 °C with either purified H. sapiens Gle1CTD or Gle1CTD•Nup42GBM. Reactions were performed with 2.5 μM DDX19, 5.0 μM Gle1CTD or Gle1CTD•Nup42GBM, 0.1 mg/ml polyA RNA, and 10.0 μM IP6. Values shown are the average of three experiments. Error bars indicate the standard deviation. See also Supplementary Fig. 13. c RNA dependence of S. cerevisiae Dbp5 activation using the same conditions as in a, but with the indicated amounts of RNA performed at 30 and 37 °C. d RNA dependence of H. sapiens DDX19 activation using the same conditions as in b, but with the indicated amounts of RNA performed at 30 and 37 °C. e IP6 dependence of (left) S. cerevisiae Dbp5 or (right) H. sapiens DDX19 activation using the same conditions as in a or b, respectively, but with the indicated amounts of IP6
Fig. 5
Structure of the human Gle1CTD•Nup42GBM•DDX19∆N53 complex. a Crystal structure of H. sapiens Gle1CTD•Nup42GBM•DDX19∆N53(ADP). Motifs of interest are colored and labeled: auto-inhibitory helix (residues 54–67, purple); mobile loop (residues 68–91, blue); trigger loop (residues 328–335, yellow); anchor loop (residues 390–403, cyan); motif VI (residues 429–435, light cyan); C-terminal helix (residues 468–479, magenta). Boxes indicate the regions shown to the right. b, c Close-up views of critical complex-forming interactions in interfaces 1 and 2. d Left: crystal structure of H. sapiens Gle1CTD•Nup42GBM•DDX19∆N53(AMP-PNP•Mg2+). DDX19 is colored magenta for clarity. Right: Superposition of the ADP and AMP-PNP•Mg2+ bound structures. e Analysis of the effect of single amino acid substitutions in the Gle1-DDX19 interface on Gle1-mediated stimulation of DDX19, using the same conditions as in Fig. 4b at 37 °C. Values shown are the average of three experiments. Error bars indicate standard deviation. f Left: crystal structure of S. cerevisiae Gle1CTD•IP6•Dbp5∆N90(ADP) (
PDB ID 3RRN
). Right: superposition of the S. cerevisiae and H. sapiens structures. The arrow indicates the rotation relating the conformations observed in the two crystal structures. Circles highlight structural differences. See also Supplementary Fig. 17
Fig. 6
Conformational changes in DDX19 induced by Gle1 binding. a Left: crystal structure of H. sapiens DDX19∆N53(ADP) (
PDB ID 3EWS
). Disordered regions (C-terminal helix and motif VI) are indicated with dashed lines. Middle: crystal structure of H. sapiens Gle1CTD•Nup42GBM•DDX19∆N53(ADP) shown in the same orientation and colored as in Fig. 5a. Right: superposition of the two structures. Arrows indicate the rotation relating the conformations of DDX19∆N53(ADP) in the presence and absence of Gle1CTD•Nup42GBM. The cartoon on the right schematizes the transition from the inhibited state to the Gle1-bound state. See also Supplementary Fig. 16. b Zoom view of the DDX19 trigger loop (yellow) in (left) the inhibited state (
PDB ID 3EWS
), (middle) the Gle1-bound state, and (right) their superposition. The cartoon on the right indicates the region of DDX19 shown. c Zoom view of the DDX19 anchor loop (cyan) and auto-inhibitory helix (purple) in the (left) inhibited state (
PDB ID 3EWS
), (middle) the Gle1-bound state, and (right) their superposition. The cartoon on the right indicates the region of DDX19 shown. d Zoom view of DDX19 Motif VI in (left) the inhibited state (
PDB ID 3EWS
), (middle) the Gle1-bound state, and (right) the RNA-bound state (
PDB ID 3G0H
). The cartoon on the right indicates the region of DDX19 shown
Fig. 7
Biochemical analysis of DDX19 activity. a Steady-state ATPase activity of DDX19 variants in the presence and absence of RNA and Gle1CTD•Nup42GBM. For schematics of the various truncation constructs, see Supplementary Fig. 18a. b Analysis of the effect of Nup214NTD on DDX19 stimulation. See also Supplementary Fig. 18. c Analysis of concentration dependence of Nup214NTD on DDX19 stimulation in the presence of RNA and Gle1CTD•Nup42GBM. d Electrophoretic mobility shift assay analysis of the effect of Gle1CTD•Nup42GBM (1 μM) and Nup214NTD (2 μM) on DDX19 (1 μM) binding to a 53-nucleotide ssRNA. RNA was visualized by staining with SYBR gold. The proteins loaded in each lane were also visualized with a Coomassie-stained SDS-PAGE gel, shown below. e Mapping single amino acid substitutions associated with human diseases LCCS1/LAAHD and ALS onto the structure of Gle1CTD•Nup42GBM•DDX19∆N53(ADP). Coloring is the same as in Fig. 5a. See also Supplementary Fig. 19. f Differential scanning fluorimetry analysis of the effect of human disease mutations on Gle1CTD•Nup42GBM stability. Exposure of hydrophobic residues monitored by an increase in relative fluorescence units (RFUs). Curves represent the average of three experiments. g Steady-state ATPase activity of DDX19 stimulation by Gle1CTD variants containing single amino acid substitutions associated with human disease. All reported values are the average of three experiments. Error bars indicate standard deviation
Fig. 8
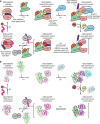
Proposed working model for the DDX19 catalytic cycle. a Schematic cartoon of the DDX19 catalytic cycle. b Schematic of the DDX19 catalytic cycle with crystal structures of each state. The inhibited conformation corresponds to the crystal structure of DDX19∆N53(ADP) (
PDB ID 3EWS
). The closed Gle1-bound conformations correspond to the crystal structures of Gle1CTD•Nup42GBM•DDX19∆N53(AMP-PNP•Mg2+) and Gle1CTD•Nup42GBM•DDX19∆N53(ADP). The Gle1-bound open conformations correspond to the yeast Gle1CTD•IP6•Dbp5∆N90(ADP) and Gle1CTD•IP6•Dbp5∆N90(ADP)•Nup159NTD (
PDB IDs 3RRM
and
3RRN
). The RNA bound conformation corresponds to the crystal structure of DDX19∆N53(AMP-PNP•Mg2+)•U10 RNA (
PDB IDs 3RRM
and
PDB ID 3G0H
). Gle1CTD•Nup42GBM and Nup214NTD correspond to the apo structures (
PDB ID 2OIT
)
Similar articles
- Nup42 and IP6 coordinate Gle1 stimulation of Dbp5/DDX19B for mRNA export in yeast and human cells.
Adams RL, Mason AC, Glass L, Aditi, Wente SR. Adams RL, et al. Traffic. 2017 Dec;18(12):776-790. doi: 10.1111/tra.12526. Epub 2017 Oct 16. Traffic. 2017. PMID: 28869701 Free PMC article. - A conserved mechanism of DEAD-box ATPase activation by nucleoporins and InsP6 in mRNA export.
Montpetit B, Thomsen ND, Helmke KJ, Seeliger MA, Berger JM, Weis K. Montpetit B, et al. Nature. 2011 Apr 14;472(7342):238-42. doi: 10.1038/nature09862. Epub 2011 Mar 27. Nature. 2011. PMID: 21441902 Free PMC article. - Activation of the DExD/H-box protein Dbp5 by the nuclear-pore protein Gle1 and its coactivator InsP6 is required for mRNA export.
Weirich CS, Erzberger JP, Flick JS, Berger JM, Thorner J, Weis K. Weirich CS, et al. Nat Cell Biol. 2006 Jul;8(7):668-76. doi: 10.1038/ncb1424. Epub 2006 Jun 18. Nat Cell Biol. 2006. PMID: 16783364 - Dbp5 - from nuclear export to translation.
Tieg B, Krebber H. Tieg B, et al. Biochim Biophys Acta. 2013 Aug;1829(8):791-8. doi: 10.1016/j.bbagrm.2012.10.010. Epub 2012 Nov 2. Biochim Biophys Acta. 2013. PMID: 23128325 Review. - Dbp5, Gle1-IP6 and Nup159: a working model for mRNP export.
Folkmann AW, Noble KN, Cole CN, Wente SR. Folkmann AW, et al. Nucleus. 2011 Nov-Dec;2(6):540-8. doi: 10.4161/nucl.2.6.17881. Epub 2011 Nov 1. Nucleus. 2011. PMID: 22064466 Free PMC article. Review.
Cited by
- Pre-ribosomal particles from nucleoli to cytoplasm.
Kubitscheck U, Siebrasse JP. Kubitscheck U, et al. Nucleus. 2024 Dec;15(1):2373052. doi: 10.1080/19491034.2024.2373052. Epub 2024 Jun 28. Nucleus. 2024. PMID: 38940456 Free PMC article. Review. - SE translation mRNA overexpression: a potential prognostic predictor in breast cancer.
Du Q, Hao R, Liu L, Liu Y, Chen S, You H, Zhang Y, Dong Y. Du Q, et al. Transl Cancer Res. 2019 Sep;8(5):2044-2052. doi: 10.21037/tcr.2019.09.11. Transl Cancer Res. 2019. PMID: 35116953 Free PMC article. - Mechanisms of nuclear mRNA export: A structural perspective.
Xie Y, Ren Y. Xie Y, et al. Traffic. 2019 Nov;20(11):829-840. doi: 10.1111/tra.12691. Epub 2019 Sep 12. Traffic. 2019. PMID: 31513326 Free PMC article. Review. - Architecture of the linker-scaffold in the nuclear pore.
Petrovic S, Samanta D, Perriches T, Bley CJ, Thierbach K, Brown B, Nie S, Mobbs GW, Stevens TA, Liu X, Tomaleri GP, Schaus L, Hoelz A. Petrovic S, et al. Science. 2022 Jun 10;376(6598):eabm9798. doi: 10.1126/science.abm9798. Epub 2022 Jun 10. Science. 2022. PMID: 35679425 Free PMC article. - The RNA helicases DDX19A/B modulate selinexor sensitivity by regulating MCL1 mRNA nuclear export in leukemia cells.
Terasaki T, Semba Y, Sasaki K, Imanaga H, Setoguchi K, Yamauchi T, Hirabayashi S, Nakao F, Akahane K, Inukai T, Sanda T, Akashi K, Maeda T. Terasaki T, et al. Leukemia. 2024 Sep;38(9):1918-1928. doi: 10.1038/s41375-024-02343-2. Epub 2024 Jul 11. Leukemia. 2024. PMID: 38987275
References
Publication types
MeSH terms
Substances
Grants and funding
- P30 EB009998/EB/NIBIB NIH HHS/United States
- R01 GM111461/GM/NIGMS NIH HHS/United States
- R01 GM117360/GM/NIGMS NIH HHS/United States
- T32 GM007616/GM/NIGMS NIH HHS/United States
LinkOut - more resources
Full Text Sources
Other Literature Sources
Molecular Biology Databases
Miscellaneous

