Inhibition of AIM2 inflammasome activation by a novel transcript isoform of IFI16 - PubMed (original) (raw)
. 2018 Oct;19(10):e45737.
doi: 10.15252/embr.201845737. Epub 2018 Aug 13.
Zi-Wei Ye 2, Jian-Jun Deng 1, Kam-Leung Siu 1, Wei-Wei Gao 1, Vidyanath Chaudhary 1, Yun Cheng 1, Sin-Yee Fung 1, Kit-San Yuen 1, Ting-Hin Ho 1, Ching-Ping Chan 1, Yan Zhang 3, Kin-Hang Kok 2, Wanling Yang 3, Chi-Ping Chan 1, Dong-Yan Jin 4
Affiliations
- PMID: 30104205
- PMCID: PMC6172465
- DOI: 10.15252/embr.201845737
Inhibition of AIM2 inflammasome activation by a novel transcript isoform of IFI16
Pei-Hui Wang et al. EMBO Rep. 2018 Oct.
Abstract
Mouse p202 is a disease locus for lupus and a dominant-negative inhibitor of AIM2 inflammasome activation. A human homolog of p202 has not been identified so far. Here, we report a novel transcript isoform of human IFI16-designated IFI16-β, which has a domain architecture similar to that of mouse p202. Like p202, IFI16-β contains two HIN domains, but lacks the pyrin domain. IFI16-β is ubiquitously expressed in various human tissues and cells. Its mRNA levels are also elevated in leukocytes of patients with lupus, virus-infected cells, and cells treated with interferon-β or phorbol ester. IFI16-β co-localizes with AIM2 in the cytoplasm, whereas IFI16-α is predominantly found in the nucleus. IFI16-β interacts with AIM2 to impede the formation of a functional AIM2-ASC complex. In addition, IFI16-β sequesters cytoplasmic dsDNA and renders it unavailable for AIM2 sensing. Enforced expression of IFI16-β inhibits the activation of AIM2 inflammasome, whereas knockdown of IFI16-β augments interleukin-1β secretion triggered by dsDNA but not dsRNA Thus, cytoplasm-localized IFI16-β is functionally equivalent to mouse p202 that exerts an inhibitory effect on AIM2 inflammasome.
Keywords: AIM2; IFI16; inflammasome; transcript isoform.
© 2018 The Authors.
Figures
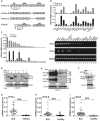
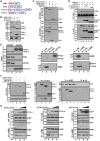
Figure 1. Expression analysis of IFI16‐β
- A
Genome structure of IFI16‐α and IFI16‐β. Boxes denote exons and lines represent introns. Positions of isoform‐specific primers used in RT–PCR and RT–qPCR analysis are indicated. PYD, HIN A, and HIN B domains are also shown. Transcription of IFI16‐β mRNA is driven by an alternative promoter located within intron 2 of IFI16‐α. - B
Distribution of IFI16‐α and IFI16‐β in human tissues. Human MTC™ Panels I and II (Clontech) containing cDNA templates of various human tissues were used for RT–qPCR analysis using isoform‐specific primers. Relative mRNA expression was derived from 2−ΔΔ_C_t by normalizing to the levels of glyceraldehyde‐3‐phosphate dehydrogenase (GAPDH) transcript. Three independent biological replicates were analyzed, and error bars indicate SD. - C
Distribution of IFI16‐α and IFI16‐β in human cell lines by isoform‐specific RT–qPCR (left) and RT–PCR (right). Three independent biological replicates were analyzed and error bars indicate SD. - D
Immunoblot analysis of recombinant IFI16‐α and IFI16‐β expressed in HEK293T cells using anti‐FLAG (α‐FLAG), anti‐IFI16 N‐terminal (α‐IFI16N), and anti‐IFI16 C‐terminal (α‐IFI16C) antibodies. - E
Induced expression of endogenous IFI16‐α and IFI16‐β in THP‐1 cells treated with recombinant IFN‐β (1000 U/ml). Both long and short exposures (exp.) of the same IFI16 blot are shown. - F
Specific knockdown of the expression of endogenous IFI16‐β in THP‐1 cells by a combination of two siRNAs targeting IFI16‐β (siIFI16‐β1+2). siNS in the non‐specific control group is an irrelevant siRNA. - G–I
mRNA expression levels of IFI16‐α, IFI16‐β, and IFN‐stimulated gene ISG15 in SLE patients and healthy individuals. Total RNA of PBMCs from SLE patients and healthy individuals (n = 24) was isolated and reverse‐transcribed into first‐strand cDNA. The expression of IFI16‐α, IFI16‐β, and ISG15 mRNAs was determined by RT–qPCR. Results were presented as dot plots showing the spread of data with the medians as well as upper and lower quartiles indicated by the three horizontal bars. Student's _t_‐test was performed to assess statistical significance of the differences between SLE patients and healthy subjects, with P values lower than 0.001 highlighted by ***.
Data information: Three independent immunoblotting experiments were carried out with similar results.Source data are available online for this figure.
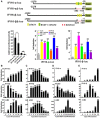
Figure 2. Induction patterns of IFI16‐α and IFI16‐β
- A
Promoter analysis and induction patterns. IFI16‐α (nucleotides −2278 to −10, with translation start site set as 1) and IFI16‐β (nucleotides −2532 to −1) promoters were individually cloned into pGL3 luciferase reporter construct to generate IFN16‐α‐luc and IFI16‐β‐luc. Their promoter activities in HEK293T cells were measured by dual‐luciferase assay. Cells were infected with HSV‐1‐ΔICP0 (MOI = 5), VSV‐GFP (MOI = 0.01), or SeV (80 HA/ml), treated with IFN‐β (1,000 U/ml), or transfected with MAVS plasmid or poly (I:C) (1.0 μg/ml). The activity recovered from the mock‐treated group transfected with pGL3 empty vector alone was set as 1. The differences between the indicated group and the mock were statistically significant as judged by Student's _t_‐test (*P < 0.05, **P < 0.01 and ***P < 0.001). - B–E
Temporal expression profiles of IFI16‐α, IFI16‐β, and AIM2 in THP‐1 cells treated with recombinant IFN‐β (1,000 U/ml), transfected with dsDNA90mer (1.0 μg/ml), infected with HSV‐1‐ΔICP0 (MOI = 5), or treated with TPA (200 nM). Cells were harvested at the indicated time points for total RNA extraction. IFI16‐α, IFI16‐β, and AIM2 transcripts were determined by RT–qPCR. The differences between the indicated group and the control at time zero were statistically significant as judged by Student's _t_‐test (*P < 0.05, **P < 0.01 and ***P < 0.001).
Data information: All bars represent the means ± SD (n = 3).
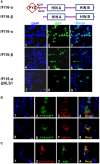
Figure 3. Subcellular localization of IFI16‐α/β and their co‐localization with AIM2
- Subcellular localization. HeLa cells were transfected individually with plasmids pcDNA6‐IFI16‐α‐eGFP, pcDNA6‐IFI16‐β‐eGFP, and pcDNA6‐IFI16‐αΔNLS1‐eGFP. After 36 h, cells were fixed, stained, and subjected to confocal microscopy. Nuclei were visualized with DAPI (blue). Scale bar, 20 μm.
- Co‐localization of IFI16‐β but not IFI16‐α, with AIM2 in the cytoplasm. Plasmid pcDNA6‐IFI16‐α‐GFP or pcDNA6‐IFI16‐β‐GFP was co‐transfected into HeLa cells together with pcDNA3.1‐AIM2‐V5. After 36 h, cells were fixed with 4% paraformaldehyde. After blocking, cells were incubated with mouse anti‐V5 and then goat anti‐mouse IgG conjugated to tetramethylrhodamine (red) to stain for AIM2. Co‐localization in the merged image is in yellow. Scale bars, 20 μm.
- Co‐localization of IFI16‐β with endogenous AIM2 in THP‐1‐derived macrophages. THP‐1 cells were transfected with IFI16‐β‐FLAG plasmid. After 24 h, cells were treated with 200 nM of TPA for another 24 h to induce differentiation into macrophages. Cells were cultured for an additional 24 h in the absence of TPA and then fixed with 4% paraformaldehyde. After blocking, cells were incubated with mouse anti‐FLAG (M2) and rabbit anti‐AIM2 antibodies overnight at 4°C. After washing, the cells were incubated with tetramethylrhodamine‐labeled goat anti‐mouse IgG (red) to stain for IFI16‐β and with fluorescein‐labeled goat anti‐rabbit IgG (green) to stain for endogenous AIM2. Scale bar, 20 μm.
Data information: Two independent experiments were performed with similar results.
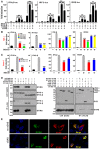
Figure 4. Role of IFI16‐β in dsDNA‐induced IFN‐β production
- IFI16‐β is a weak activator of IFN‐β production in HEK293 cells. Cells were transfected with the indicated combinations of plasmids expressing IFI16‐α (450 ng), IFI16‐β (450 ng), STING (20 ng) and cGAS (20 ng) together with IFNβ‐luc, IRF3‐luc or ISRE‐luc reporter (20 ng). pcDNA6 empty vector was used to equalize the total amount of transfected DNA. Dual‐luciferase assays were performed 36 h after transfection. Three independent biological replicates were analyzed, and error bars indicate SD. The differences between the indicated groups were judged to be either statistically significant (**P < 0.01 and ***P < 0.001) or not significant (NS) by Student's _t_‐test.
- Knockdown of endogenous IFI16‐β in THP‐1 cells impairs dsDNA‐induced IFN‐β and ISG54 expression. Cells cultured in six‐well plates were transfected with 1 μl of either an irrelevant (siNS) or IFI16‐targeting siRNA (100 mM) as indicated. After 48 h, THP‐1 cells were transfected with dsDNA90mer (1,000 ng/ml) for 9 h and then collected for RT–qPCR analysis. Three independent biological replicates were analyzed and error bars indicate SD. The differences between the indicated group and the siNS control were statistically significant as judged by Student's _t_‐test (**P < 0.01 and ***P < 0.001).
- Knockdown of IFI16‐β in human MDMs diminishes dsDNA‐induced IFN‐β and ISG54 expression. Human MDMs cultured in 24‐well plates were repeatedly transfected with 0.5 μl of the indicated siRNA (100 mM) for three times with a 24‐h interval. After another 24 h, human MDMs were transfected with dsDNA90mer (1,000 ng/ml) twice with a 6‐h interval. Human MDMs were then collected for RT–qPCR analysis. Three independent biological replicates were analyzed, and error bars indicate SD. The differences between the indicated group and the siNS control were statistically significant as judged by Student's _t_‐test (**P < 0.01 and ***P < 0.001).
- IFI16‐β interacts with STING. The indicated combinations of expression plasmids for human STING‐HA (hSTING‐HA or STING‐HA; 1,000 ng), mouse STING‐HA (mSTING‐HA; 1,000 ng), IFI16‐α‐FLAG (9,000 ng), IFI16‐β‐FLAG (9,000 ng), PYD‐FLAG (9,000 ng), mouse p204‐FLAG (9,000 ng), and mouse p202‐FLAG (9,000 ng) were transfected into HEK293T cells. After 48 h, cells were harvested and lysed. Immunoprecipitation (IP) was carried out with mouse anti‐HA or anti‐FLAG antibody.
- Co‐localization of IFI16‐β with STING. IFI16‐β‐GFP and STING‐HA plasmids were co‐transfected with or without cGAS plasmid into HeLa cells. After 36 h, cells were fixed, blocked, and then incubated initially with mouse anti‐HA for 12 h at 4°C and subsequently with goat anti‐mouse IgG conjugated to tetramethylrhodamine (red) to stain for STING‐HA. Nuclear morphology was revealed with DAPI (blue). Scale bars, 20 μm.
Data information: Immunoblotting and confocal imaging results are representative of two independent experiments.Source data are available online for this figure.
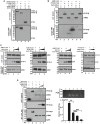
Figure 5. IFI16‐β interacts with AIM2 to impede AIM2‐ASC complex formation
- Domain structure of AIM2, p202, IFI16‐α, and IFI16‐β. PYDs and the HIN domains (A, B or C) are indicated.
- IFI16‐β interacts with AIM2. A plasmid expressing FLAG‐tagged AIM2 was co‐transfected with IFI16‐α‐V5 or IFI16‐β‐V5 plasmid into HEK293T cells. After 48 h, cells were harvested and lysed. Immunoprecipitation (IP) was carried out with mouse anti‐FLAG antibody. Input proteins were analyzed by immunoblotting with mouse anti‐FLAG or anti‐V5 antibody. Immunoprecipitates were probed with rabbit anti‐FLAG or anti‐V5 antibodies.
- IFI16 HIN domains, but not PYD, are required for interaction with AIM2. AIM2‐V5 plasmid was co‐transfected with IFI16‐α‐FLAG, IFI16‐β‐FLAG, or IFI16 PYD‐FLAG construct into HEK293T cells. After 48 h, cells were harvested and lysed. Co‐immunoprecipitation was carried out with mouse anti‐V5 antibody. Input proteins were analyzed by immunoblotting with mouse anti‐FLAG. Immunoprecipitates were probed with rabbit anti‐V5 antibodies.
- Overexpression of IFI16‐β inhibits AIM2‐ASC complex formation in HEK293T cells. Cells were co‐transfected with the indicated combinations of expression plasmids for AIM2‐V5, ASC‐HA, IFI16‐β‐FLAG, and p202‐FLAG. After 48 h, cells were harvested and lysed. Immunoprecipitation was carried out with mouse anti‐V5 antibody. Input proteins were analyzed by immunoblotting with mouse anti‐FLAG, anti‐HA, or anti‐V5 antibody. Immunoprecipitates were probed with rabbit anti‐FLAG, anti‐HA, or anti‐FLAG antibodies.
- Interaction between endogenous IFI16‐β and AIM2 proteins in THP‐1‐derived macrophages. THP‐1 cells were differentiated into macrophages by overnight treatment with TPA (200 nM). Cells were harvested for cytosolic and nuclear fractionation. Immunoprecipitation was performed using mouse anti‐IFI16C or anti‐AIM2 antibody. Mouse anti‐HA served as a control. The immune complexes were detected by immunoblotting with rabbit anti‐IFI16N or anti‐AIM2 antibodies.
- Association of IFI16‐β with endogenous AIM2 in HeLa cells. HeLa cells were transfected with the indicated combinations of plasmids expressing IFI16‐α‐FLAG, IFI16‐β‐FLAG, and GFP‐FLAG. Cells were then stimulated with IFN‐β (1,000 U/ml) to induce endogenous AIM2 expression. After 48 h, cells were harvested and lysed. Immunoprecipitation was carried out with mouse anti‐FLAG or anti‐AIM2 antibody. Immunoprecipitates were probed with rabbit anti‐FLAG or anti‐AIM2 antibodies.
- Overexpression of IFI16‐β impedes AIM2‐ASC complex formation in THP‐1 cells. Cells were transfected with increasing doses of IFI16‐α‐FLAG, IFI16‐β‐FLAG, or GFP‐FLAG plasmids. After 24 h, cells were differentiated into macrophages by overnight treatment with TPA (200 nM). Cells were then harvested and lysed. Endogenous AIM2 was immunoprecipitated using mouse anti‐AIM2 antibody. The immune complexes were probed with rabbit anti‐ASC or anti‐AIM2 antibodies.
Data information: Three independent experiments were carried out with similar results.Source data are available online for this figure.
Figure 6. IFI16‐β binds dsDNA to prevent it from binding to AIM2
- IFI16‐α and IFI16‐β, but not PYD, were pulled down by biotinylated dsDNA90mer (biotin‐90mer). Plasmids expressing the indicated proteins were transfected into HEK293T. After 24 h, cells were further transfected with biotinylated dsDNA90mer. After another 3 hours, cells were lysed and biotin–DNA pull‐down assay was carried out using streptavidin agarose.
- IFI16‐β and AIM2 were pulled down by biotinylated dsDNA90mer. The indicated proteins were overexpressed in HEK293T cells. After 24 h, biotinylated or non‐biotinylated dsDNA90mer was delivered into cells. Three hours later, cells were lysed and biotin–DNA pull‐down assay was carried out.
- IFI16‐β competes with AIM2 for dsDNA binding. HEK293T cells were transfected with plasmids expressing the indicated proteins. After 24 h, cells were further transfected with biotinylated dsDNA90mer. Three hours later, cells were harvested and lysed. Biotin–DNA pull‐down assay was carried out by incubating 10 μl streptavidin agarose with cell lysate for 3 h at 4°C. The agarose beads were washed five times with lysis buffer and then boiled in SDS–PAGE sample buffer. The precipitated proteins were visualized by immunoblotting with mouse anti‐FLAG antibody.
- Binding of IFI16‐β and AIM2 with dsDNA90mer and inhibition of AIM2 binding with dsDNA90mer by IFI16‐β**.** HEK293T cells were transfected with plasmids expressing the indicated proteins. After 24 h, cells were further transfected with dsDNA90mer (1,000 μg/ml). After another 3 h, cells were fixed for 5 min in 4% paraformaldehyde and quenched with 1 M Tris–Cl pH 7.4 for 5 min at room temperature. Fixed cells were washed with PBS and lysed in lysis buffer (50 mM Tris–Cl pH 7.4, 150 mM NaCl, 1 mM EDTA, 0.1% NP‐40, and 1.25% Triton X‐100). Immunoprecipitation was carried out with mouse anti‐FLAG antibody at 4°C overnight. Immunoprecipitated complexes were washed five times with lysis buffer and then diluted in elution buffer (10 mM Tris–Cl, 1 mM EDTA and 0.65% SDS). To reverse the crosslinking, samples were incubated overnight at 65°C and then treated with 20 μg/ml RNase A for 30 min at 37°C. Proteins were digested with 10 μg/ml proteinase K for 2 h at 45°C. DNA was purified by Wizard® SV Gel and PCR Clean‐Up System as per the manufacturer's instructions. The bound dsDNA90mer was detected by PCR and qPCR with previously described specific primers 62. Three independent biological replicates were analyzed and error bars indicate SD. The differences between the indicated groups were statistically significant as judged by Student's _t_‐test (**P < 0.01 and ***P < 0.001).
Data information: Three independent experiments were performed with similar results.Source data are available online for this figure.
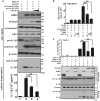
Figure 7. Overexpression of IFI16‐β inhibits dsDNA‐induced AIM2 inflammasome activation
- Reconstitution of AIM2 inflammasome activation in HEK293T cells by co‐transfection of AIM2, ASC, procaspase‐1, and pro‐IL‐1β plasmids. Mature IL‐1β secreted into the culture supernatants was detected by immunoblotting and ELISA (**P < 0.01 by Student's _t_‐test).
- HEK293T cells were transiently transfected with plasmids expressing iGLuc (50 ng), procaspase‐1 (5 ng), ASC (5 ng), and either AIM2 (50 ng) or NLRP3 (50 ng). Increasing doses of IFI16‐β plasmid (50 ng in lanes 3 and 6, and 150 ng in lanes 4 and 7) were co‐transfected. Empty vector pcDNA6 was used to balance total amount of transfected DNA. Cell lysates were assessed 24 h after transfection for luciferase activity. RLU, relative luciferase unit (**P < 0.01 by Student's _t_‐test).
- THP‐1 cells were transfected with plasmids expressing the indicated proteins for 24 h and then differentiated by treatment with 10 nM TPA for 12 h. Cells were cultured with fresh medium without TPA for 12 h and transfected with dsDNA90mer (4.0 μg/ml). After another 12 h, cells were harvested for immunoblot analysis and the culture supernatants were collected for the detection of mature IL‐1β secretion by ELISA (**P < 0.01 by Student's _t_‐test).
Data information: Three independent biological replicates were analyzed and error bars indicate SD.Source data are available online for this figure.
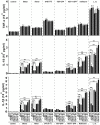
Figure 8. Knockdown of endogenous IFI16‐β, but not IFI16‐α augmented cytoplasmic dsDNA‐induced IL‐1β and IL‐18 secretion in differentiated THP‐1 cells
THP‐1 cells were transfected with the indicated siRNA. After 12 h, THP‐1 cells were differentiated into macrophages by treatment with 10 nM TPA for another 24 h. Cells were cultured for an additional 12 h without TPA. siRNA‐transfected cells were further transfected with dsDNA90mer (4.0 μg/ml), transfected with VACV70mer (4.0 μg/ml), transfected with poly (I:C) (4.0 μg/ml), infected with VSV‐GFP (MOI = 0.01), infected with HSV‐1‐GFP (MOI = 5), exposed to nelfinavir (50 μM), or infected with Listeria monocytogenes (L. m., MOI = 5). After another 12 h, culture supernatants were collected for the detection of mature TNF‐α, IL‐18, and IL‐1β by ELISA. Three independent biological replicates were analyzed, and error bars indicate SD (**P < 0.01 and ***P < 0.001 by Student's _t_‐test).
Figure 9. Knockdown of endogenous IFI16‐β, but not IFI16‐α augmented cytoplasmic dsDNA‐induced IL‐1β and IL‐18 secretion in human MDMs
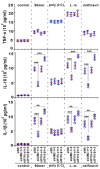
Human MDMs (2.5 × 10⁵/ml) cultured in 24‐well plates were repeatedly transfected with 0.5 μl of indicated siRNA for three times at 24‐h intervals. After another 6 h, human MDMs were primed with LPS (1 μg/ml) for 6 h and then the culture medium was replaced with fresh RPMI1640. Two groups of cells were transfected twice with dsDNA90mer (4.0 μg/ml) and poly (I:C) (4.0 μg/ml), respectively, at 6‐h intervals. The other two groups of cells were infected with Listeria monocytogenes (L.m., MOI = 5) or exposed to nelfinavir (50 μM) at 6 h after the change of medium. After another 12 h, culture supernatants were collected for detection of mature TNF‐α, IL‐18, and IL‐1β by ELISA. Results were obtained from human MDMs derived from four different donors and presented as dot plots showing the distribution of data with the medians as well as upper and lower quartiles indicated by the three horizontal bars (**P < 0.01 and ***P < 0.001 by Student's _t_‐test). Two independent experiments were performed with similar results.
Similar articles
- Molecular mechanism for p202-mediated specific inhibition of AIM2 inflammasome activation.
Yin Q, Sester DP, Tian Y, Hsiao YS, Lu A, Cridland JA, Sagulenko V, Thygesen SJ, Choubey D, Hornung V, Walz T, Stacey KJ, Wu H. Yin Q, et al. Cell Rep. 2013 Jul 25;4(2):327-39. doi: 10.1016/j.celrep.2013.06.024. Epub 2013 Jul 11. Cell Rep. 2013. PMID: 23850291 Free PMC article. - Differential Activation of NLRP3, AIM2, and IFI16 Inflammasomes in Humans with Acute and Chronic Hepatitis B.
Chen H, He G, Chen Y, Zhang X, Wu S. Chen H, et al. Viral Immunol. 2018 Nov;31(9):639-645. doi: 10.1089/vim.2018.0058. Epub 2018 Sep 15. Viral Immunol. 2018. PMID: 30222506 - IFI16 protein mediates the anti-inflammatory actions of the type-I interferons through suppression of activation of caspase-1 by inflammasomes.
Veeranki S, Duan X, Panchanathan R, Liu H, Choubey D. Veeranki S, et al. PLoS One. 2011;6(10):e27040. doi: 10.1371/journal.pone.0027040. Epub 2011 Oct 28. PLoS One. 2011. PMID: 22046441 Free PMC article. - Effects of AIM2 and IFI16 on Infectious Diseases and Inflammation.
Fan Z, Chen R, Yin W, Xie X, Wang S, Hao C. Fan Z, et al. Viral Immunol. 2023 Sep;36(7):438-448. doi: 10.1089/vim.2023.0044. Epub 2023 Aug 16. Viral Immunol. 2023. PMID: 37585649 Review. - Interferon-inducible p200-family protein IFI16, an innate immune sensor for cytosolic and nuclear double-stranded DNA: regulation of subcellular localization.
Veeranki S, Choubey D. Veeranki S, et al. Mol Immunol. 2012 Jan;49(4):567-71. doi: 10.1016/j.molimm.2011.11.004. Epub 2011 Dec 2. Mol Immunol. 2012. PMID: 22137500 Free PMC article. Review.
Cited by
- Type I interferon (IFN)-inducible Absent in Melanoma 2 proteins in neuroinflammation: implications for Alzheimer's disease.
Choubey D. Choubey D. J Neuroinflammation. 2019 Nov 26;16(1):236. doi: 10.1186/s12974-019-1639-5. J Neuroinflammation. 2019. PMID: 31771614 Free PMC article. Review. - Nuclear antiviral innate responses at the intersection of DNA sensing and DNA repair.
Justice JL, Cristea IM. Justice JL, et al. Trends Microbiol. 2022 Nov;30(11):1056-1071. doi: 10.1016/j.tim.2022.05.004. Epub 2022 May 28. Trends Microbiol. 2022. PMID: 35641341 Free PMC article. Review. - Inflammasome activation: from molecular mechanisms to autoinflammation.
Lara-Reyna S, Caseley EA, Topping J, Rodrigues F, Jimenez Macias J, Lawler SE, McDermott MF. Lara-Reyna S, et al. Clin Transl Immunology. 2022 Jul 7;11(7):e1404. doi: 10.1002/cti2.1404. eCollection 2022. Clin Transl Immunology. 2022. PMID: 35832835 Free PMC article. Review. - Function and Regulation of Nuclear DNA Sensors During Viral Infection and Tumorigenesis.
Zhang F, Yuan Y, Ma F. Zhang F, et al. Front Immunol. 2021 Jan 11;11:624556. doi: 10.3389/fimmu.2020.624556. eCollection 2020. Front Immunol. 2021. PMID: 33505405 Free PMC article. Review. - AIM2 in health and disease: Inflammasome and beyond.
Kumari P, Russo AJ, Shivcharan S, Rathinam VA. Kumari P, et al. Immunol Rev. 2020 Sep;297(1):83-95. doi: 10.1111/imr.12903. Epub 2020 Jul 26. Immunol Rev. 2020. PMID: 32713036 Free PMC article. Review.
References
- Schattgen SA, Fitzgerald KA (2011) The PYHIN protein family as mediators of host defenses. Immunol Rev 243: 109–118 - PubMed
Publication types
MeSH terms
Substances
LinkOut - more resources
Full Text Sources
Other Literature Sources
Molecular Biology Databases
Miscellaneous
