Dysfunctional CD8 T Cells Form a Proliferative, Dynamically Regulated Compartment within Human Melanoma - PubMed (original) (raw)
. 2019 Feb 7;176(4):775-789.e18.
doi: 10.1016/j.cell.2018.11.043. Epub 2018 Dec 27.
Anne M van der Leun 2, Ido Yofe 1, Yaniv Lubling 3, Dikla Gelbard-Solodkin 1, Alexander C J van Akkooi 4, Marlous van den Braber 2, Elisa A Rozeman 5, John B A G Haanen 5, Christian U Blank 5, Hugo M Horlings 6, Eyal David 1, Yael Baran 3, Akhiad Bercovich 3, Aviezer Lifshitz 3, Ton N Schumacher 7, Amos Tanay 8, Ido Amit 9
Affiliations
- PMID: 30595452
- PMCID: PMC7253294
- DOI: 10.1016/j.cell.2018.11.043
Dysfunctional CD8 T Cells Form a Proliferative, Dynamically Regulated Compartment within Human Melanoma
Hanjie Li et al. Cell. 2019.
Erratum in
- Dysfunctional CD8 T Cells Form a Proliferative, Dynamically Regulated Compartment within Human Melanoma.
Li H, van der Leun AM, Yofe I, Lubling Y, Gelbard-Solodkin D, van Akkooi ACJ, van den Braber M, Rozeman EA, Haanen JBAG, Blank CU, Horlings HM, David E, Baran Y, Bercovich A, Lifshitz A, Schumacher TN, Tanay A, Amit I. Li H, et al. Cell. 2020 Apr 30;181(3):747. doi: 10.1016/j.cell.2020.04.017. Cell. 2020. PMID: 32359441 No abstract available.
Abstract
Tumor immune cell compositions play a major role in response to immunotherapy, but the heterogeneity and dynamics of immune infiltrates in human cancer lesions remain poorly characterized. Here, we identify conserved intratumoral CD4 and CD8 T cell behaviors in scRNA-seq data from 25 melanoma patients. We discover a large population of CD8 T cells showing continuous progression from an early effector "transitional" into a dysfunctional T cell state. CD8 T cells that express a complete cytotoxic gene set are rare, and TCR sharing data suggest their independence from the transitional and dysfunctional cell states. Notably, we demonstrate that dysfunctional T cells are the major intratumoral proliferating immune cell compartment and that the intensity of the dysfunctional signature is associated with tumor reactivity. Our data demonstrate that CD8 T cells previously defined as exhausted are in fact a highly proliferating, clonal, and dynamically differentiating cell population within the human tumor microenvironment.
Keywords: T cell dysfunction; immune checkpoints; immunology; immunotherapy; melanoma; single-cell RNA-seq; tumor immunology; tumor microenvironment; tumor reactivity.
Copyright © 2018 Elsevier Inc. All rights reserved.
Conflict of interest statement
Declaration of Interests
A patent application has been filed related to this work.
Figures
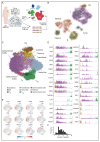
Figure 1. Profiling immune infiltrates in human melanoma with scRNA-seq and scTCR-seq.
A. Graphical overview of the experimental setting. Single immune cells were collected from human melanoma, and processed by MARS-seq for transcriptional profiling, and scTCR-seq for clonotype analysis of T cells. B. Two-dimensional (2D) projection of expression profiles of 47,772 single cells (46,612 immune cells and 1,160 malignant cells) from tumor lesions partitioned into 324 metacells. Single cells are shown in dots. Metacells consisting of related cells are connected with edges and are positioned in proximity, broad immune cell subsets are annotated and marked by color code. C. 2D projection of sub-clustered T and NK cells. A total of 29,825 cells are represented in 218 metacells from the model shown in B, annotated in 9 groups and marked by color code. D. Expression (molecules/1,000 UMIs) of select genes across the T/NK metacell model. E. 2D projection of a selected set of marker genes over the metacell model. F. Distribution of the number of patients contributing to each metacell. Only patients with at least 2 cells in the metacell are considered as contributors. See also Figure S1 and Table S1-3.
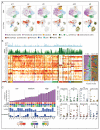
Figure 2. Transcriptional gradients of tumor infiltrating T cells.
A. Gene-gene correlation heatmap of top variable genes within CD8 T metacells. B. Bar graph showing the top 30 genes that are most correlated with LAG3 across CD8 T metacells. This set of 30 “dysfunctional” genes is subsequently used to calculate dysfunctional scores. Scatter plots depict the dysfunctional score per metacell versus log enrichment of a selected set of dysfunctional genes. C. Similar to panel B, but showing the top 30 genes most correlated with FGFBP2, defining the cytotoxic score. The correlation of a selected set of cytotoxic genes with the cytotoxic score per metacell is shown. D. Cytotoxic score versus dysfunctional score on CD8 metacells. E. Top transcription factors correlated with the dysfunctional score (right) and cytotoxic score (left). F. Shown are differences of dysfunctional and cytotoxic scores per metacell (X axis) versus the prediction (Y axis) of a linear model using TF expression alone (10-fold cross validation, lasso regularized). Inferred non-zero coefficients for TF variables are shown to the right. G. Bar graph showing the top 30 genes with the highest correlation to IL2RA (Treg score). H. Transcription factors with the highest correlation to the Treg score. I. Linear model using transcription factors to predict the Treg score, similar to panel F. J. Gene enrichment in dysfunctional and Treg cells over naïve-like cells. A selected set of highly expressed genes (mean molecules per cell >= 0.05) is depicted, highlighting key genes either distinct or shared among the two groups. K. Treg score versus dysfunctional score on all metacells. Different groups of metacells are color-coded as in panel D. See also Figure S2.
Figure 3. Inter-patient variation in the composition of dysfunctional CD8 T cell and other immune cell populations.
A. 2D projections of the composition of T and NK cell populations (top), and non-T/NK immune cell populations (bottom) in different patients. Six representative patients ordered by their fraction of dysfunctional CD8 T cells within all T cells are depicted. B. Metacells (columns) are ordered by groups and clustered within each group. Top panel shows the number of cells in the metacell. Second panel shows the top contributing patients to each metacell. Bar height is the fraction of cells, top patient in dark green, second patient in light green, remaining patients in white. Patients are ordered based on the frequency of dysfunctional CD8 T cells. Compositions of T cells and other immune cells are shown on the right (colors as in Figure 1 for T/NK cells and Figure S3 for non-T/NK cells). C. Patients are ordered by the fraction of dysfunctional CD8 T cells within all T cells and binned into 3 groups (low, intermediate, and high fraction of dysfunctional CD8 T cells). Disease stage, tumor location (LN: Lymph node; MSC: muscle; (S)C: (sub)cutaneous; p(S)C: primary (sub)cutaneous), treatment background (N: naïve; T: treated; IT: immunotherapy treated), percentage of CD3+ cells within total immune cells measured by flow cytometry, and percentage of tumor immune infiltrates measured by histology are depicted (Methods), grey bars represent missing data. D. Frequency of different immune populations within the three groups of patients defined in panel (C) with each circle representing a patient and horizontal line the group median. Spearman correlation between the fraction of the group and the fraction of the dysfunctional group are shown on top, with stars marking significant p-value of a Mann-Whitney test between patients in the low and high groups (*P < 0.05; **P < 0.01; ***P < 1 × 10⁻³). See also Figure S3-4 and Table S4.
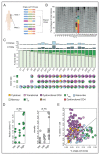
Figure 4. Clonal expansion within the dysfunctional CD8 T cell compartment.
A. Graphical overview of the use of scTCR-seq to identify shared clones between two independent lesions from the same patient. B. Overview of TCR clonality for all patients, showing the size of each T cell clone (largest at the bottom, smallest at the top) in each tumor. Corresponding TCRs from two lesions of the same patient are marked. C. Clonal composition of T cells in patients, showing from top to bottom the number of distinct clones per patient, the number of T cells of which the TCR was retrieved, the distribution of clones by size (size =1, size =2, and size >2 cells), and pie charts showing the cell type composition of each patient clones stratified by clone size (shown are data representing at least 10 cells). Patients are ordered by the fraction of their size-one clones. D. The fraction of clones with >2 cells (left) and patient clonality score (right; defined by Pielou’s evenness) are shown for patients grouped by their fraction of dysfunctional CD8 cells, as in Figure 3D. E. Metacells composition. Showing per metacell the fraction of cells with a unique TCR (clone size=1, x-axis) versus fraction of cells with a recurring TCR (clone size >1, y-axis). See also Figure S5.
Figure 5. CD8 T cells in early dysfunctional state are highly proliferative.
A. Fraction of proliferating cells per metacell, calculated by defining a cell as proliferative by its fraction of cell cycle genes expression out of total expression. Circle size reflects the percentages of proliferating cells in the metacell, using the 2D projection as in Figure 1C. B. Percentage of proliferating cells in the different immune cell types and subtypes, number of cells per metacell group are shown on the right. C-D. Fraction of proliferating cells in dysfunctional (C) and Treg (D) groups of cells, stratifying cells by their dysfunctional score (C) and Treg score (D). Scores defined as in Figure 2. E. Cell subtype composition of T cell clones of intermediate size (shared by 8-20 cells, left) or large size (shared by more than 20 cells, right). Clones are hierarchically clustered, patient ID are shown on the bottom and clone ID on top. F. Pairwise clone sharing propensity by different T cell groups. Data depict the enrichment of the observed number of cell pairs sharing TCRs by their associated group over a control generated by multiple repetitions of random sampling of cells from individual patients, taking into account the TCR detection probability (shown in Figure S5A), while preserving the number of clones and clone sizes per patient. See also Figure S5-7 and Table S5-6.
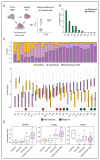
Figure 6. Relationship between cell states and tumor-reactivity of T cells.
A. Graphical overview of the method to assess T cell reactivity. Ex vivo expanded TILs were co-cultured with autologous tumor cells to examine the presence of a tumor-specific TCR repertoire by analysis of IFNg and TNFa secretion. B. tumor-reactivity is depicted as the percentage of T cells that secrete IFNg and/or TNFa after co-culture with autologous tumor material. Tumor-reactivity of expanded TIL was assayed for 10 patients. C. The fraction of UMIs from genes of the dysfunctional program and cytotoxic program were calculated for each CD8 T cell, and the distribution of these fractions across all CD8 T cells are shown per patient. Patients are ordered by the median of the UMI percentage of the dysfunctional gene program. T cell subtype composition within CD8 T cells is shown on top for each patient. Green and red circles mark patients with reactive and non-reactive TIL, respectively. D. Expression enrichment per metacell of tumor-specific and bystander T cell marker genes, including ENTPD1, ITGAE, and KLRG1, in different T cell subtypes. See also Figure S7.
Similar articles
- Clonality of CD4+ Blood T Cells Predicts Longer Survival With CTLA4 or PD-1 Checkpoint Inhibition in Advanced Melanoma.
Arakawa A, Vollmer S, Tietze J, Galinski A, Heppt MV, Bürdek M, Berking C, Prinz JC. Arakawa A, et al. Front Immunol. 2019 Jun 18;10:1336. doi: 10.3389/fimmu.2019.01336. eCollection 2019. Front Immunol. 2019. PMID: 31275310 Free PMC article. - Checkpoint blockade immunotherapy enhances the frequency and effector function of murine tumor-infiltrating T cells but does not alter TCRβ diversity.
Kuehm LM, Wolf K, Zahour J, DiPaolo RJ, Teague RM. Kuehm LM, et al. Cancer Immunol Immunother. 2019 Jul;68(7):1095-1106. doi: 10.1007/s00262-019-02346-4. Epub 2019 May 18. Cancer Immunol Immunother. 2019. PMID: 31104075 Free PMC article. - Single-Cell Transcriptomic Analysis Reveals a Tumor-Reactive T Cell Signature Associated With Clinical Outcome and Immunotherapy Response In Melanoma.
Yan M, Hu J, Ping Y, Xu L, Liao G, Jiang Z, Pang B, Sun S, Zhang Y, Xiao Y, Li X. Yan M, et al. Front Immunol. 2021 Nov 5;12:758288. doi: 10.3389/fimmu.2021.758288. eCollection 2021. Front Immunol. 2021. PMID: 34804045 Free PMC article. - Effector, Memory, and Dysfunctional CD8(+) T Cell Fates in the Antitumor Immune Response.
Reiser J, Banerjee A. Reiser J, et al. J Immunol Res. 2016;2016:8941260. doi: 10.1155/2016/8941260. Epub 2016 May 22. J Immunol Res. 2016. PMID: 27314056 Free PMC article. Review. - Immune infiltrates in the breast cancer microenvironment: detection, characterization and clinical implication.
Burugu S, Asleh-Aburaya K, Nielsen TO. Burugu S, et al. Breast Cancer. 2017 Jan;24(1):3-15. doi: 10.1007/s12282-016-0698-z. Epub 2016 May 2. Breast Cancer. 2017. PMID: 27138387 Review.
Cited by
- Cutaneous T cell lymphoma atlas reveals malignant TH2 cells supported by a B cell-rich tumor microenvironment.
Li R, Strobl J, Poyner EFM, Balbaa A, Torabi F, Mazin PV, Chipampe NJ, Stephenson E, Ramírez-Suástegi C, Shanmugiah VBM, Gardner L, Olabi B, Coulthard R, Botting RA, Zila N, Prigmore E, Gopee NH, Chroscik MA, Kritikaki E, Engelbert J, Goh I, Chan HM, Johnson HF, Ellis J, Rowe V, Tun W, Reynolds G, Yang D, Foster AR, Gambardella L, Winheim E, Admane C, Rumney B, Steele L, Jardine L, Nenonen J, Pickard K, Lumley J, Hampton P, Hu S, Liu F, Liu X, Horsfall D, Basurto-Lozada D, Grimble L, Bacon CM, Weatherhead SC, Brauner H, Wang Y, Bai F, Reynolds NJ, Allen JE, Jonak C, Brunner PM, Teichmann SA, Haniffa M. Li R, et al. Nat Immunol. 2024 Nov 18. doi: 10.1038/s41590-024-02018-1. Online ahead of print. Nat Immunol. 2024. PMID: 39558094 - Single-cell transcriptomic landscape deciphers olfactory neuroblastoma subtypes and intra-tumoral heterogeneity.
Yang J, Song X, Zhang H, Liu Q, Wei R, Guo L, Yuan C, Chen F, Xue K, Lai Y, Wang L, Shi J, Zhou C, Wang J, Yu Y, Mei Q, Hu L, Wang H, Zhang C, Zhang Q, Li H, Gu Y, Zhao W, Yu H, Wang J, Liu Z, Li H, Zheng S, Liu J, Yang L, Li W, Xu R, Chen J, Zhou Y, Cheng X, Yu Y, Wang D, Sun X, Yu H. Yang J, et al. Nat Cancer. 2024 Nov 14. doi: 10.1038/s43018-024-00855-5. Online ahead of print. Nat Cancer. 2024. PMID: 39543363 - Epigenetics behind CD8+ T cell activation and exhaustion.
Zu H, Chen X. Zu H, et al. Genes Immun. 2024 Nov 14. doi: 10.1038/s41435-024-00307-1. Online ahead of print. Genes Immun. 2024. PMID: 39543311 Review. - Cancer-associated fibroblast subtypes modulate the tumor-immune microenvironment and are associated with skin cancer malignancy.
Forsthuber A, Aschenbrenner B, Korosec A, Jacob T, Annusver K, Krajic N, Kholodniuk D, Frech S, Zhu S, Purkhauser K, Lipp K, Werner F, Nguyen V, Griss J, Bauer W, Soler Cardona A, Weber B, Weninger W, Gesslbauer B, Staud C, Nedomansky J, Radtke C, Wagner SN, Petzelbauer P, Kasper M, Lichtenberger BM. Forsthuber A, et al. Nat Commun. 2024 Nov 8;15(1):9678. doi: 10.1038/s41467-024-53908-9. Nat Commun. 2024. PMID: 39516494 Free PMC article. - TMED inhibition suppresses cell surface PD-1 expression and overcomes T cell dysfunction.
Vredevoogd DW, Apriamashvili G, Levy PL, Sinha S, Huinen ZR, Visser NL, de Bruijn B, Boshuizen J, van Hal-van Veen SE, Ligtenberg MA, Bleijerveld OB, Lin CP, Díaz-Gómez J, Sánchez SD, Markovits E, Simon Nieto J, van Vliet A, Krijgsman O, Markel G, Besser MJ, Altelaar M, Ruppin E, Peeper DS. Vredevoogd DW, et al. J Immunother Cancer. 2024 Nov 7;12(11):e010145. doi: 10.1136/jitc-2024-010145. J Immunother Cancer. 2024. PMID: 39510795 Free PMC article.
References
- Ahrends T, Spanjaard A, Pilzecker B, Babala N, Bovens A, Xiao Y, Jacobs H, Borst J. CD4+T Cell Help Confers a Cytotoxic T Cell Effector Program Including Coinhibitory Receptor Downregulation and Increased Tissue Invasiveness. Immunity. 2017;47:848–861.e5. - PubMed
- Bergmann S, Ihmels J, Barkai N. Iterative signature algorithm for the analysis of large-scale gene expression data. Phys Rev E. 2003;67 031902. - PubMed
Publication types
MeSH terms
Substances
Grants and funding
- 724471/ERC_/European Research Council/International
- 724824/ERC_/European Research Council/International
- 742259/ERC_/European Research Council/International
- HHMI/Howard Hughes Medical Institute/United States
LinkOut - more resources
Full Text Sources
Other Literature Sources
Medical
Research Materials
Miscellaneous


