Adventitial Stromal Cells Define Group 2 Innate Lymphoid Cell Tissue Niches - PubMed (original) (raw)
. 2019 Mar 19;50(3):707-722.e6.
doi: 10.1016/j.immuni.2019.02.002. Epub 2019 Feb 26.
Stephen W Jones 1, Kelly M Cautivo 1, Alexandra Dubinin 1, Jorge F Ortiz-Carpena 1, Sepideh Farhat 1, Kevin S Yu 2, Katharine Lee 2, Chaoqun Wang 3, Anna V Molofsky 4, Aaron D Tward 2, Matthew F Krummel 5, Tien Peng 3, Ari B Molofsky 6
Affiliations
- PMID: 30824323
- PMCID: PMC6553479
- DOI: 10.1016/j.immuni.2019.02.002
Adventitial Stromal Cells Define Group 2 Innate Lymphoid Cell Tissue Niches
Madelene W Dahlgren et al. Immunity. 2019.
Abstract
Type 2 lymphocytes promote both physiologic tissue remodeling and allergic pathology, yet their physical tissue niches are poorly described. Here, we used quantitative imaging to define the tissue niches of group 2 innate lymphoid cells (ILC2s), which are critical instigators of type 2 immunity. We identified a dominant adventitial niche around lung bronchi and larger vessels in multiple tissues, where ILC2s localized with subsets of dendritic and regulatory T cells. However, ILC2s were most intimately associated with adventitial stromal cells (ASCs), a mesenchymal fibroblast-like subset that expresses interleukin-33 (IL-33) and thymic stromal lymphopoietin (TSLP). In vitro, ASCs produced TSLP that supported ILC2 accumulation and activation. ILC2s and IL-13 drove reciprocal ASC expansion and IL-33 expression. During helminth infection, ASC depletion impaired lung ILC2 and Th2 cell accumulation and function, which are in part dependent on ASC-derived IL-33. These data indicate that adventitial niches are conserved sites where ASCs regulate type 2 lymphocyte expansion and function.
Keywords: 3D-imaging; IL-33; ILC2s; TSLP; Th2 cells; allergic asthma; group 2 innate lymphoid cells; mesenchymal cells; resident lymphocytes; stromal cells; tissue niches; type 2 immunity.
Copyright © 2019 Elsevier Inc. All rights reserved.
Conflict of interest statement
DECLARATION OF INTERESTS
The authors declare no competing interests.
Figures
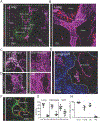
Figure 1:. ILC2s localize to adventitial cuffs in multiple organs.
(A and B) 3D rendering with zoom of a 200μm thick lung slice with IL-5+ ILC2 (RFP), bronchioles (autofluor+ Lyve−), arteries (Lyve1dim+, Autofluor+, bronchiole−adjacent), veins (Lyve1dim+ Autofluor+, non-bronchiole adjacent) and lymphatics (Lyve1bright+, Autofluor−) visualized. (C and D) IL-5 RFP+ ILC2 and CD31+ vessels visualized in (C) brain meninges and (D) perigonadal adipose tissue (GAT). (E and F) IL-5 RFP+ ILC2 visualized in the lung adventitial cuff, highlighted by a lack of (E) Aquaporin 5 and SMA, and positively by (F) Col1A1 rich cuff regions surrounding bronchioles and arteries. (G) 3D image quantification of IL-5 RFP+ ILC2s localized within the cuff volume, using automatic surfacing (lungs), or found within 40μm of SMA+ vasculature (meninges, GAT). (H) Percent of cells in lung cuffs: ILC2 (IL-5 RFP+), T-cells (CD3ε+), DCs (CD11c+ MHCII+ co-positive) and alveolar macrophages (AM, CD11c+ MHCII−). Analysis in (G) included lung cuff, parenchyma, and pleural regions, whereas (H) excluded pleura. (A-E) Images are representative of 3 or more mice or (F) 2 mice. (G and H) Data points represent averages of individual mice with n ≥5 animals with ≥55 cells of each type analyzed per mouse. See also Figures S1–3 and Movies S1 and S2.
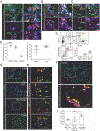
Figure 2:. ILC2s are associated with CD11b+ dendritic cells at cuff sites.
(A-C) 3D rendering with zoom of 200μm projections from (A) lung, (B) liver, or (C) kidney, highlighting IL-5 RFP+ ILC2 and CD11c+ MHCII+ myeloid cells, most consistent with dendritic cells (DCs). (D) Image analysis of 3D thick sections from lung, liver, and kidney for indicated populations; association defined as <900nm between the nearest ILC2 and DC surface vertices. (**E**) Flow cytometry analysis of lung DC subsets. (**F-I**) 2D-thin cut images of ILC2 localization (yellow arrows) with (**F**) CD11b+ DCs or (**G and H**) CD301b+ CD11b+ DCs from indicated tissues, with **(I)** quantification of co-localization. Occasional CD11b-neg DCs (**F**) or CD301b-neg DCs (**G**) are indicated with stars. (**A-C, E-H**) Representative of three or more mice. (**D,I**) Data points represent averages of individual mice n=3–4 with >n=25 cells analyzed for per animal. See also Figure S3.
Figure 3:. ILC2s localize with adventitial stromal cells expressing IL-33.
(A) 3D rendering with zoom of a 200μm thick projection from a lung airway-artery region. (B-D) PDGFRαGFP+ stromal cells were surfaced and binned using GFP and IL-33 median colocalization into 3 groups: PDGFRαGFPhi, IL-33-neg parenchymal stroma (blue), GFPlow IL-33-neg cuff ASCs (green), and GFPlow IL-33+ ASCs (magenta). (E-F) Quantification of (E) percent ILC2s (IL-5 RFP+) less than 5μm apart from blood vessels (Lyve1+ SMA-proximal), lymphatic vessels (Lyve1+ SMA−), smooth muscle (SMA+), or PDGFRα+ stroma (GFP+), or (F) distance from ILC2 (IL-5 RFP+) to nearest cell type, or (G) distance from ILC2 to nearest PDGFRαGFPlow ASC subset (IL-33+ vs IL-33neg). (H) Lung 2D section highlighting ILC2 (IL-5 RFP+) and IL-7GFP+ lymphatics. (I) Flow cytometry analysis of IL-7GFP and wild-type controls for the indicated populations. (J) Flow cytometry analysis of ILC2s (Lin− Thy1+ Gata3hi) in developing wild-type (WT) lungs at indicated post-natal days (P2, P12, P19, >8wk old adults). (K and L) 3D imaging of 200μm thick section from pups at indicated ages, analyzing (K) percent ILC2s in the lung cuff and (L) localization between ILC2s and PDGFRαGFP+ stroma. (M and N) 3D rendering of (M) 25um or (N) 52um volume from lungs at indicated post-natal ages highlighting ILC2 localization. (E,F,J-L) Data points represent (E, J-L) average per mouse or (F) aggregation of five individual mice (N=237). (A-D, H-I, M-N) Representative images, surfaces, or flow cytometry analysis for three or more mice. See also Figure S3 and Movies S3 and S4.
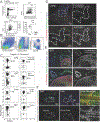
Figure 4:. ASCs express IL-33mcherry, Sca1 and Gp38 and are widely distributed in tissues.
(A-C) Flow cytometry plots and quantification from (A) lung of PDGFRαGFP+ IL-33mcherry mice (black) or wild-type gating controls (grey) or (B and C) indicated tissues, including pre-gating strategy. (D and E) 2D thin-cut images with zooms from (D) lung or (E) subcutaneous adipose tissue (SAT) with inguinal lymph node (ILN) or (F) gonadal adipose tissue (GAT), liver, and brain meninges, with antibody stains indicated and PDGFRαGFP – IL33mcherry colocalization highlighted (white). Flow cytometry plots and images are representative of three or more mice. See also Figure S4.
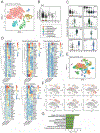
Figure 5:. ASCs are a distinct IL-33 expressing fibroblast-like subset expressing genes associated with matrix remodeling and inflammation.
(A) Unsupervised clustering analysis of scRNAseq on IL-33mcherry+ CD45− cells from naïve lung visualized with t-SNE. Each dot indicates an individual cell (total cell number: 3584). A mixed subset comprising apparent epithelial with endothelial cell doublets (cluster 1) and a small hematopoietic contaminating subset (cluster 5) were identified and not analyzed further. (B and C) Violin plots of (B) Il33 or (C) selected genes used to assign cluster identity. (D) Heatmaps of mean expression values of top 25 genes in ASCs (cluster 2) in indicated gene category across clusters identified in (A). Data is log-transformed. Genes were assigned to categories using Ingenuity Pathway Analysis (IPA). (E) Unsupervised clustering of aggregated total CD45-negative and IL-33+ (mCherry+) cells from naïve lung visualized with t-SNE. Each dot indicates an individual cell (total cell number: 5392). (F) Gene expression of ASC-associated genes projected onto tSNE plots. (G) Gene ontology analysis in DAVID of cluster 5 differentially expressed genes. See also Figure S5 and Table S1.
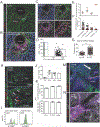
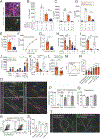
Figure 6:. ASCs produce TSLP to support ILC2s, whereas ILC2s and IL-13 in turn promote ASC accumulation and IL-33 expression.
(A) Bulk lung stroma was co-cultured with ILC2s for 3 days and imaged with IL-5 RFP+ ILC2 clusters indicated. (B-D) PDGFRα Sca1+ (ASCs, orange) and PDGFRα+ Sca1− (parenchymal-enriched, blue) stromal cells were cultured with lung ILC2s for 7 days and ILC2s were (B) counted and (C and D) IL-5 and IL-13 amounts measured from culture supernatants. (E-I) Culture media (CM) from ASCs (Sca1+, orange), control parenchymal-enriched SCs (Sca1−, blue), or fresh culture media (white) was plated with freshly sorted ILC2s for (F) 3 days or (E,H,I) 5 days +/− the indicated blocking antibodies or TSLP supplementation (10ng/mL), or (G) assayed for TSLP. (J and K) Indicated lung T cell subsets sorted from IL-33 treated mice were (J) co-cultured with the stromal cell subsets for 5 days without TCR stimulation or (K) cultured with ASC culture media (orange) or fresh culture media (white) +/− the indicated blocking antibodies or TSLP (10ng/mL). (L) ASCs from WT or IL-33 deficient mice were subjected to 3 rounds of freeze-thaw lysis, after which ILC2s were co-cultured for 5 days. (M and N) IL-33mcherry+ ASCs were cultured for 5 days post confluency with the indicated cells or cytokines (10ng/mL) and assessed for IL-33mcherry, showing (M) representative histogram or (N) percent of IL-33mcherry expressing cells. (O) Mice were infected with 500 N. brasiliensis or treated x3 with 500ng of IL-33 and examined for the indicated markers. (P) 200um thick tissue slices were analyzed at the indicated points post N. brasiliensis infection or (Q) post papain treatment (x3 daily doses), ILC2s (IL-5 RFP+ CD3e−), Th2 cells (IL-5 RFP+ CD3e+), and cuff regions (Aqp5−, bronchovascular-associated) were defined and the association enumerated. (R-S) Flow cytometry analysis of lungs on N. brasiliensis post-infection (PI) days indicated with (R) representative ASC flow cytometry plots and (S) quantification of ASC IL-33mcherry expression. (T) 2D thin-cut lung images at day 28 PI from ILC2-deleter (Il5-cre; R26-DTA) and control Il5-cre) mice with IL-5+ cells and IL-33+ cells highlighted. Data are (A,C,D,I,K,M,R) representative or (B,E-H,J,L,N) aggregated from 2–3 independent cohorts. (O,T) Representative images of two independent experiments. (P,Q,S) Aggregated data from two independent experiments, each data point represents one mouse. Independent cohorts indicated in (J and L) with black and grey symbols. See also Figure S6.
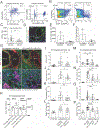
Figure 7:. ASCs support ILC2s and the induction of lung type 2 inflammation.
(A) Flow cytometry analysis of lungs from _Gli1_-GFP mice (left) or _Gli1-cre_ERT2; R26-YFP tamoxifen treated lineage trackers (right). (B and C) _Gli1_-_cre_ERT2; R26-DTA mice (tamoxifen treated) with (C) enumeration of ASC depletion. (D) Lung 2D thin-cut image from _Gli1-cre_ERT2; R26-YFP tamoxifen treated mice. (E-G) 3D imaging with quantitation of ASC-replete (_Cre_-neg; R26DTA) or ASC-deplete (_Gli1-cre_ERT2+; R26-DTA) IL-33+ nuclei in adventitial cuff spaces at day 12 PI with N. brasiliensis (H-P) Flow cytometry quantification of (H) blood and bone marrow or (I-P) lungs from tamoxifen treated N. brasiliensis infected mice at PI D12–14 from the indicated strains (ASC-depleted, ASC-IL-33 Flox), quantifying ILC2s, eosinophils, Th2 cells, and Gata3hi Treg cells. (A,B,D,G,H) Representative plots, images, or experiments from 2 or more mice. (C, I-P) Pooled data from greater than 3 experiments, with individual mice shown. (E,F) Three individual mice analyzed for each genotype. See also Figure S7.
Similar articles
- IL-33-experienced group 2 innate lymphoid cells in the lung are poised to enhance type 2 inflammation selectively in adult female mice.
Aldossary H, Karkout R, Couto K, Labrie L, Fixman ED. Aldossary H, et al. Respir Res. 2024 Dec 4;25(1):427. doi: 10.1186/s12931-024-03043-2. Respir Res. 2024. PMID: 39633345 Free PMC article. - Eosinophils promote effector functions of lung group 2 innate lymphoid cells in allergic airway inflammation in mice.
LeSuer WE, Kienzl M, Ochkur SI, Schicho R, Doyle AD, Wright BL, Rank MA, Krupnick AS, Kita H, Jacobsen EA. LeSuer WE, et al. J Allergy Clin Immunol. 2023 Aug;152(2):469-485.e10. doi: 10.1016/j.jaci.2023.03.023. Epub 2023 Apr 6. J Allergy Clin Immunol. 2023. PMID: 37028525 Free PMC article. - Group 2 innate lymphoid cells are a non-redundant source of interleukin-5 required for development and function of murine B1 cells.
Troch KF, Jakob MO, Forster PM, Jarick KJ, Schreiber J, Preusser A, Guerra GM, Durek P, Tizian C, Sterczyk N, Helfrich S, Duerr CU, Voehringer D, Witkowski M, Artis D, Rollenske T, Kruglov AA, Mashreghi MF, Klose CSN. Troch KF, et al. Nat Commun. 2024 Dec 4;15(1):10566. doi: 10.1038/s41467-024-54780-3. Nat Commun. 2024. PMID: 39632879 Free PMC article. - Depressing time: Waiting, melancholia, and the psychoanalytic practice of care.
Salisbury L, Baraitser L. Salisbury L, et al. In: Kirtsoglou E, Simpson B, editors. The Time of Anthropology: Studies of Contemporary Chronopolitics. Abingdon: Routledge; 2020. Chapter 5. In: Kirtsoglou E, Simpson B, editors. The Time of Anthropology: Studies of Contemporary Chronopolitics. Abingdon: Routledge; 2020. Chapter 5. PMID: 36137063 Free Books & Documents. Review. - Trends in Surgical and Nonsurgical Aesthetic Procedures: A 14-Year Analysis of the International Society of Aesthetic Plastic Surgery-ISAPS.
Triana L, Palacios Huatuco RM, Campilgio G, Liscano E. Triana L, et al. Aesthetic Plast Surg. 2024 Oct;48(20):4217-4227. doi: 10.1007/s00266-024-04260-2. Epub 2024 Aug 5. Aesthetic Plast Surg. 2024. PMID: 39103642 Review.
Cited by
- CD200-CD200R immune checkpoint engagement regulates ILC2 effector function and ameliorates lung inflammation in asthma.
Shafiei-Jahani P, Helou DG, Hurrell BP, Howard E, Quach C, Painter JD, Galle-Treger L, Li M, Loh YE, Akbari O. Shafiei-Jahani P, et al. Nat Commun. 2021 May 5;12(1):2526. doi: 10.1038/s41467-021-22832-7. Nat Commun. 2021. PMID: 33953190 Free PMC article. - Asthmatic lung fibroblasts promote type 2 immune responses via endoplasmic reticulum stress response dependent thymic stromal lymphopoietin secretion.
Drake LY, Koloko Ngassie ML, Roos BB, Teske JJ, Prakash YS. Drake LY, et al. Front Physiol. 2023 Jan 25;14:1064822. doi: 10.3389/fphys.2023.1064822. eCollection 2023. Front Physiol. 2023. PMID: 36760534 Free PMC article. - Group 2 innate lymphoid cells and their surrounding environment.
Naito M, Kumanogoh A. Naito M, et al. Inflamm Regen. 2023 Mar 20;43(1):21. doi: 10.1186/s41232-023-00272-8. Inflamm Regen. 2023. PMID: 36941691 Free PMC article. Review. - CD105+CD90+CD13+ identifies a clonogenic subset of adventitial lung fibroblasts.
Kadefors M, Rolandsson Enes S, Åhrman E, Michaliková B, Löfdahl A, Dellgren G, Scheding S, Westergren-Thorsson G. Kadefors M, et al. Sci Rep. 2021 Dec 24;11(1):24417. doi: 10.1038/s41598-021-03963-9. Sci Rep. 2021. PMID: 34952905 Free PMC article. - Innate lymphoid cells control signaling circuits to regulate tissue-specific immunity.
Klose CSN, Artis D. Klose CSN, et al. Cell Res. 2020 Jun;30(6):475-491. doi: 10.1038/s41422-020-0323-8. Epub 2020 May 6. Cell Res. 2020. PMID: 32376911 Free PMC article.
References
- Cano E, Gebala V, Gerhardt H, 2017. Pericytes or Mesenchymal Stem Cells: Is That the Question? Stem Cell 20, 296–297. - PubMed
- Cayrol C, Girard J-P, 2018. Interleukin-33 (IL-33): A nuclear cytokine from the IL-1 family. Immunol. Rev 281, 154–168. - PubMed
- Chai Q, Onder L, Scandella E, Gil-Cruz C, Perez-Shibayama C, Cupovic J, Danuser R, Sparwasser T, Luther SA, Thiel V, Rülicke T, Stein JV, Hehlgans T, Ludewig B, 2013. Maturation of Lymph Node Fibroblastic Reticular Cells from Myofibroblastic Precursors Is Critical for Antiviral Immunity. Immunity 38, 1013–1024. - PMC - PubMed
- Chang JE, Turley SJ, 2015. Stromal infrastructure of the lymph node and coordination of immunity. Trends Immunol 36, 30–39. - PubMed
Publication types
MeSH terms
Substances
Grants and funding
- K08 DK101604/DK/NIDDK NIH HHS/United States
- R01 HL142701/HL/NHLBI NIH HHS/United States
- R56 HL142701/HL/NHLBI NIH HHS/United States
- T32 CA108462/CA/NCI NIH HHS/United States
LinkOut - more resources
Full Text Sources
Molecular Biology Databases
Miscellaneous
