Multiomics Profiling Establishes the Polypharmacology of FDA-Approved CDK4/6 Inhibitors and the Potential for Differential Clinical Activity - PubMed (original) (raw)
Multiomics Profiling Establishes the Polypharmacology of FDA-Approved CDK4/6 Inhibitors and the Potential for Differential Clinical Activity
Marc Hafner et al. Cell Chem Biol. 2019.
Abstract
The target profiles of many drugs are established early in their development and are not systematically revisited at the time of FDA approval. Thus, it is often unclear whether therapeutics with the same nominal targets but different chemical structures are functionally equivalent. In this paper we use five different phenotypic and biochemical assays to compare approved inhibitors of cyclin-dependent kinases 4/6-collectively regarded as breakthroughs in the treatment of hormone receptor-positive breast cancer. We find that transcriptional, proteomic, and phenotypic changes induced by palbociclib, ribociclib, and abemaciclib differ significantly; abemaciclib in particular has advantageous activities partially overlapping those of alvocidib, an older polyselective CDK inhibitor. In cells and mice, abemaciclib inhibits kinases other than CDK4/6 including CDK2/cyclin A/E-implicated in resistance to CDK4/6 inhibition-and CDK1/cyclin B. The multifaceted experimental and computational approaches described here therefore uncover underappreciated differences in CDK4/6 inhibitor activities with potential importance in treating human patients.
Keywords: CDK4/6 inhibitors; abemaciclib; breast cancer; cancer therapeutics; drug mechanisms of action; drug profiling; kinase inhibitors; palbociclib; ribociclib.
Copyright © 2019 Elsevier Ltd. All rights reserved.
Conflict of interest statement
Declaration of interests:
MH is currently an employee of Genentech, Inc and RAE of Pfizer, Inc; they declare no conflicts of interest. DJ reports personal fees from Novartis, Genentech, Eisai, Ipsen, and EMD Serono, during the conduct of the study. PKS is a member of the SAB or Board of Directors of Merrimack Pharmaceutical, Glencoe Software, Applied Biomath and RareCyte Inc, has equity in these companies, and declares that none of these relationships are directly or indirectly related to the content of this manuscript. Other authors have no conflicts of interest.
Figures
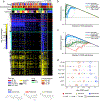
Figure 1:. Transcriptional responses of breast cancer cell lines to CDK4/6 inhibitors.
(a) Clustering of transcriptional responses for seven breast cancer cell lines treated for 6 or 24 hours with ribociclib, palbociclib, or abemaciclib at 0.3, 1, or 3 μM. Only genes for which statistically significant (FDR < 0.2) changes were observed in at least 3 conditions are shown. Down-regulated genes comprising signature 1 and 2 are outlined in red and cyan, respectively, and the gray box denotes the cluster containing expression profiles with the highest signature 2 scores. (b-c) Enrichment scores for signature 1 (b) and 2 (c) based on L1000 signatures identified by Enrichr (see STAR Methods). (d) Score of the pan-CDK transcriptional signature per cell line following six hours of exposure to drug based on RNA-seq data from panel (a).
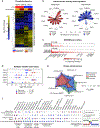
Figure 2:. G1-arrest and pan-CDK scores induced by CDK4/6 inhibitors.
Score of the G1-arrest signature relative to the pan-CDK signature for seven cell lines treated with palbociclib, ribociclib, abemaciclib, or alvociclib at 0.1, 0.3, 1, or 3 μM; squares denote pRb-deficient lines. Distributions of scores for pRb-competent lines are shown at the margins for each signature.
Figure 3:. Inhibition of CDK/cyclin activity by CDK4/6 inhibitors.
(a) Clustering of changes in phosphopeptide levels for MCF7 cells treated for 1 hour with either abemaciclib or palbociclib at 0.3 or 3 μM. (b) Normalized enrichment scores for kinases based on the phosphoproteomic data in panel (a). Only kinases inferred as significantly down-regulated (FDR < 0.2) in at least two conditions are shown. (c) Fraction of unbound kinases at 0.1 and 1 μM of each CDK4/6 inhibitor as measured by the KINOMEscan assay for the top 100 bound kinases plus kinases inferred in (b) (see Figure S2). CAMKIIα, CDK6, PKCγ, and PKCζ were not present in the panel. (d) Degree of inhibition (log2 fold change) of each CDK as detected by MIB/MS after treating a mixed cell lysate with a CDK4/6 inhibitor at the doses indicated. (e) _IC_50 values for CDK/cyclin complexes for CDK4/6 inhibitors and alvocidib as measured using purified kinases in vitro (see Figure S3). (f) Summary of kinases that were assayed by phosphoproteomics, KINOMEscan, MIB/MS, and SelectScreen. Each slice of the pie represents inhibition by abemaciclib, ribociclib, palbociclib, or alvocidib. For each assay, slices are colored only if the corresponding drug substantially inhibited the kinases (defined as FDR < 0.2 for phosphoproteomic inference, 90% inhibition at 1 μM drug by KINOMEscan, log2 fold-change < −0.45 for MIB/MS, or _IC_50 < 0.5 μM by in vitro kinase assays). An ‘x’ inside a slice denotes that that drug was not profiled in that assay. A large ‘X’ in place of a pie indicates that that kinase was not profiled in that assay. Bound complexes such as CDK4/cyclin D1 or CDK4/cyclin D3 cannot be disambiguated in kinase inference and MIB/MS assays and are therefore depicted as a single entity within a box.
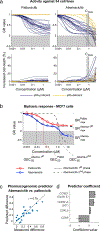
Figure 4:. Comparison of the phenotypic response of breast cancer cell lines to CDK4/6 inhibitors.
(a) GR curves for cell growth (top) and increase of dead cells relative to a vehicle-only control (bottom) for 26 pRb-proficient breast cancer cell lines (blue) and 8 pRb-deficient cell lines (yellow) treated with palbociclib (left) or abemaciclib (right) for 72 hours. The vertical box illustrates the maximum serum concentration for abemaciclib (C max). (b) Dose-response curve for palbociclib (red) and abemaciclib (blue) in MCF7 cells. Dotted lines depict two fitted sigmoidal curves whose product optimally recapitulates the blue curve with extracted values for _GEC_50 (50%-maximal effective concentration) shown below and for GR max (maximal efficacy) shown to the right (See Figure S4). (c-d) Performance of a pharmacogenomic predictor of palbociclib vs. abemaciclib drug response constructed from data on mRNA levels for 30 cell cycle regulators; (c) shows the observed versus predicted (leave-one-out cross validation) difference in GR value at 3 μM between palbociclib and abemaciclib based on a linear model containing the expression of four genes, whose coefficients are shown in (d); error bars represent the standard error of the model.
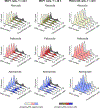
Figure 5:. Comparison of the effects of ribociclib, palbociclib, and abemaciclib on the cell cycle.
Distribution of DNA content in MCF7 cells exposed to one of three CDK4/6 inhibitors over a range of concentrations for 24 (left) or 48 (middle) hours, and in PDX-1258 cells, which are pRb-deficient, exposed to the same conditions for 48 hours (right). In each curve the phospho-pRb positive cell population is depicted in a darker shade. One representative replicate out of three is shown.
Figure 6:. Transcriptional response of MCF-7 xenografted cells to CDK4/6 inhibitors
(a) Fraction of phospho-pRb positive tumor cells in MCF-7 xenografts after four days of CDK4/6 inhibitor treatment. (b) Score of the pan-CDK transcriptional signature as compared to the G1-arrest signature across MCF-7 tumors following four days of exposure to drug; same analysis as in Figure 2.
Figure 7:. Acute and adaptive responses of breast cancer cell lines and tumors to CDK4/6 inhibitors.
(a) Time-dependent GR values for MCF7, Hs 578T, and PDX12–58 cells treated with 3.16 μM ribociclib, palbociclib, or abemaciclib for up to five days. One representative replicate out of four is shown. (b) Western Blots of cyclin E and total pRb levels in Hs 578T and MCF7 parental cells and in cells adapted to grow in 1 μM palbociclib. (c) GR values for Hs 578T and MCF7 parental cells and cells adapted to grow in 1 μM palbociclib following exposure to 3.16 μM ribociclib, palbociclib, or abemaciclib for 72 h (see Figure S7); * denotes P < 0.05 and ** P < 0.01 as measured using a t-test with six replicates in each group. Error bars denote SEM of six replicates. (d) GR values (left) and increase in dead cells relative to a vehicle-only control (right) for the patient-derived line MGH312 in response to 96-hour exposure to ribociclib, palbociclib, or abemaciclib. Error bars show the SEM of three replicates. (e) CT scan of patient with metastatic HR+/HER2- breast cancer showing a liver lesion prior to palbociclib/fulvestrant treatment (1st panel); upon complete radiographic regression of the lesion following 7 months of palbociclib/fulvestrant treatment (2nd panel); reappearance of the lesion after 20 months on palbociclib/fulvestrant (3rd panel); and regression of the lesion 3 months after a switch to treatment with abemaciclib (last panel).
Similar articles
- Clinical Management of Potential Toxicities and Drug Interactions Related to Cyclin-Dependent Kinase 4/6 Inhibitors in Breast Cancer: Practical Considerations and Recommendations.
Spring LM, Zangardi ML, Moy B, Bardia A. Spring LM, et al. Oncologist. 2017 Sep;22(9):1039-1048. doi: 10.1634/theoncologist.2017-0142. Epub 2017 Jul 13. Oncologist. 2017. PMID: 28706010 Free PMC article. Review. - A unique CDK4/6 inhibitor: Current and future therapeutic strategies of abemaciclib.
Chong QY, Kok ZH, Bui NL, Xiang X, Wong AL, Yong WP, Sethi G, Lobie PE, Wang L, Goh BC. Chong QY, et al. Pharmacol Res. 2020 Jun;156:104686. doi: 10.1016/j.phrs.2020.104686. Epub 2020 Feb 14. Pharmacol Res. 2020. PMID: 32068118 Review. - Biological specificity of CDK4/6 inhibitors: dose response relationship, in vivo signaling, and composite response signature.
Knudsen ES, Hutcheson J, Vail P, Witkiewicz AK. Knudsen ES, et al. Oncotarget. 2017 Jul 4;8(27):43678-43691. doi: 10.18632/oncotarget.18435. Oncotarget. 2017. PMID: 28620137 Free PMC article. - CDK4/6 Inhibition as a therapeutic strategy in breast cancer: palbociclib, ribociclib, and abemaciclib.
Laderian B, Fojo T. Laderian B, et al. Semin Oncol. 2017 Dec;44(6):395-403. doi: 10.1053/j.seminoncol.2018.03.006. Epub 2018 Mar 26. Semin Oncol. 2017. PMID: 29935901 Review. - Comparative analysis of adverse events associated with CDK4/6 inhibitors based on FDA's adverse event reporting system: a case control pharmacovigilance study.
Lin W, Zeng Y, Weng L, Yang J, Zhuang W. Lin W, et al. BMC Pharmacol Toxicol. 2024 Aug 9;25(1):47. doi: 10.1186/s40360-024-00770-6. BMC Pharmacol Toxicol. 2024. PMID: 39123221 Free PMC article.
Cited by
- Proteomic characterization of post-translational modifications in drug discovery.
Zhai LH, Chen KF, Hao BB, Tan MJ. Zhai LH, et al. Acta Pharmacol Sin. 2022 Dec;43(12):3112-3129. doi: 10.1038/s41401-022-01017-y. Epub 2022 Nov 13. Acta Pharmacol Sin. 2022. PMID: 36372853 Free PMC article. Review. - Therapies for the Treatment of Advanced/Metastatic Estrogen Receptor-Positive Breast Cancer: Current Situation and Future Directions.
Rej RK, Roy J, Allu SR. Rej RK, et al. Cancers (Basel). 2024 Jan 27;16(3):552. doi: 10.3390/cancers16030552. Cancers (Basel). 2024. PMID: 38339303 Free PMC article. Review. - Role of Clathrin and Dynamin in Clathrin Mediated Endocytosis/Synaptic Vesicle Recycling and Implications in Neurological Diseases.
Prichard KL, O'Brien NS, Murcia SR, Baker JR, McCluskey A. Prichard KL, et al. Front Cell Neurosci. 2022 Jan 18;15:754110. doi: 10.3389/fncel.2021.754110. eCollection 2021. Front Cell Neurosci. 2022. PMID: 35115907 Free PMC article. Review. - Clinical Experience with Abemaciclib in Patients Previously Treated with Another CDK 4/6 Inhibitor in a Tertiary Hospital: A Case Series Study.
de Luna Aguilar AM, Fuentes JDB, Ortega Anselmi J, Olalla Inoa J, Flores Navarro P, Lopez de Sá A, Fuentes Antras J, Rodríguez Rey C, Ortega Candil A, Moreno Antón F, García Sáenz JÁ. de Luna Aguilar AM, et al. Cancers (Basel). 2023 Sep 7;15(18):4452. doi: 10.3390/cancers15184452. Cancers (Basel). 2023. PMID: 37760421 Free PMC article. - Resistance Mechanisms to Combined CDK4/6 Inhibitors and Endocrine Therapy in ER+/HER2- Advanced Breast Cancer: Biomarkers and Potential Novel Treatment Strategies.
Al-Qasem AJ, Alves CL, Ditzel HJ. Al-Qasem AJ, et al. Cancers (Basel). 2021 Oct 27;13(21):5397. doi: 10.3390/cancers13215397. Cancers (Basel). 2021. PMID: 34771560 Free PMC article. Review.
References
- Balko JM, Giltnane JM, Wang K, Schwarz LJ, Young CD, Cook RS, Owens P, Sanders ME, Kuba MG, Sánchez V, et al. (2014). Molecular profiling of the residual disease of triple-negative breast cancers after neoadjuvant chemotherapy identifies actionable therapeutic targets. Cancer Discov 4, 232–245. - PMC - PubMed
- Beausoleil SA, Villén J, Gerber SA, Rush J, and Gygi SP (2006). A probability-based approach for high-throughput protein phosphorylation analysis and site localization. Nat. Biotechnol 24, 1285–1292. - PubMed
Publication types
MeSH terms
Substances
LinkOut - more resources
Full Text Sources
Other Literature Sources
Molecular Biology Databases
Miscellaneous


