Platycodigenin as Potential Drug Candidate for Alzheimer's Disease via Modulating Microglial Polarization and Neurite Regeneration - PubMed (original) (raw)
Platycodigenin as Potential Drug Candidate for Alzheimer's Disease via Modulating Microglial Polarization and Neurite Regeneration
Zhiyou Yang et al. Molecules. 2019.
Abstract
Neuroinflammatory microenvironment, regulating neurite regrowth and neuronal survival, plays a critical role in Alzheimer's disease (AD). During neuroinflammation, microglia are activated, inducing the release of inflammatory or anti-inflammatory factors depending on their polarization into classical M1 microglia or alternative M2 phenotype. Therefore, optimizing brain microenvironment by small molecule-targeted microglia polarization and promoting neurite regeneration might be a potential therapeutic strategy for AD. In this study, we found platycodigenin, a naturally occurring triterpenoid, promoted M2 polarization and inhibited M1 polarization in lipopolysaccharide (LPS)-stimulated BV2 and primary microglia. Platycodigenin downregulated pro-inflammatory molecules such as interleukin (IL)-1β, tumor necrosis factor (TNF)-α, IL-6 and nitric oxide (NO), while upregulated anti-inflammatory cytokine IL-10. Further investigation confirmed that platycodigenin inhibited cyclooxygenase-2 (Cox2) positive M1 but increased Ym1/2 positive M2 microglial polarization in primary microglia. In addition, platycodigenin significantly decreased LPS-induced the hyperphosphorylation of mitogen-activated protein kinase (MAPK) p38 and nuclear factor-κB (NF-κB) p65 subunits. Furthermore, the inactivation of peroxisome proliferators-activated receptor γ (PPARγ) induced by LPS was completely ameliorated by platycodigenin. Platycodigenin also promoted neurite regeneration and neuronal survival after Aβ treatment in primary cortical neurons. Taken together, our study for the first time clarified that platycodigenin effectively ameliorated LPS-induced inflammation and Aβ-induced neurite atrophy and neuronal death.
Keywords: PPARγ; microglial polarization; neurite regeneration; platycodigenin.
Conflict of interest statement
The authors declare no conflict of interest.
Figures
Figure 1
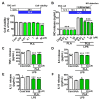
Effects of platycodigenin (PLA) on Lipopolysaccharide (LPS)-induced NO and pro-inflammatory cytokines production in BV2 microglia. BV2 microglia were seeded in 96-well plates for 12 h, followed by treatment with PLA for 36 h (A) and the cell viability was assayed. BV2 microglia (2 × 10⁵ cells/mL) were seeded in 48-well plates for 12 h, followed by pretreatment with PLA for 12 h and then LPS (100 ng/mL) was stimulated for another 24 h. NO release (B) was detected by Griess reagent method and concentrations of TNF-α (C), IL-6 (D), IL-1β (E) and IL-10 (F) were determined by ELISA kit. The data are shown as the mean ± SEM of three independent experiments. Each group has five replicates in the independent experiment. *p < 0.05, and ***p < 0.001 versus vehicle (Veh), Kruskal-Wallis one-way analysis of variance by ranks test and one-way analysis of variance and Dunnett’s post hoc test.
Figure 2
Effects of platycodigenin (PLA) on LPS-induced mRNA expression of M1/M2 microglia markers. BV2 microglia were cultured for 12 h and pretreated with PLA (1 and 10 μM) or control (Cont, 0.1% DMSO) for another 12 h, followed by stimulation with LPS (100 ng/mL) for 12 h. The expression of M1/M2 markers were determined by qPCR analysis. (A) Experimental schedule. (B–H) The mRNA expression of TNF-α, IL-1β, iNOS, IL4, CD206, Arg1 and TGFβ were quantified. The data are shown as the mean ± SEM of three independent experiments. Each group has four replicates in the independent experiment. *p < 0.05, **p < 0.01, and ***p < 0.001 versus vehicle (Veh), Kruskal-Wallis one-way analysis of variance by ranks test.
Figure 3
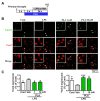
Effects of platycodigenin (PLA) on LPS-induced primary microglial polarization. Primary microglia were cultured for 2 h and pretreated with PLA (1 and 10 μM) or control (Cont, 0.1% DMSO) for another 2 h, followed by stimulation with LPS (100 ng/mL) for 24 h. The expression of Cox2 and Ym1/2 were determined by immunocytochemistry. (A) Experimental schedule. (B) The representative images immunostained for M1 microglia (Cox2 [red]) and M2 microglia (Ym1/2 [green]). (C) Cox2 and Ym1/2 expression per cell were quantified. The data are normalized to the control and shown as the mean ± SEM of three independent experiments. Ten images were captured of each group in the independent experiment. *p < 0.05 and ***p < 0.001 versus vehicle (Veh), Kruskal-Wallis one-way analysis of variance by ranks test.
Figure 4
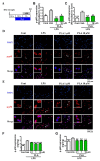
Effects of platycodigenin (PLA) on LPS-induced phosphorylation of NF-κB p65 and MAPK p38. BV2 microglia were cultured for 12 h and pretreated with PLA (1 and 10 μM) or control (Cont, 0.1% DMSO) for another 12 h, followed by stimulation with LPS (100 ng/mL) for 1 h. The cells were fixed and immunostained for _p_-p65 and _p_-p38. The fluorescent intensity was measured. (A) Experimental schedule. Phosphorylation of p65 (B) and p38 (C) per cell were quantified. The representative images of _p_-p65 (D) and _p_-p38 (E) were showed. (F,G) Phosphorylation of p65 and p38 per mg total protein were quantified by ELISA kit. The data are normalized to the control and shown as the mean ± SEM of three independent experiments. Ten images were captured (B-E) and four replicates (F-G) were performed of each group in the independent experiment. *p < 0.05, **p < 0.01, and ***p < 0.001 versus vehicle (Veh), Kruskal-Wallis one-way analysis of variance by ranks test and one-way analysis of variance and Dunnett’s post hoc test.
Figure 5
Effects of platycodigenin (PLA) on LPS-induced expression of PPARγ. BV2 microglia were cultured for 12 h and pretreated with PLA (1 and 10 μM) or control (Cont, 0.1% DMSO) for another 12 h, followed by stimulation with LPS (100 ng/mL) for 24 h. The cells were fixed and immunostained for pparγ. The fluorescent intensity of the pparγ positive cells were measured. (A) Experimental schedule. (B) The expression of PPARγ per cell were quantified. (C) The representative images immunostained for PPARγ. The data are normalized to the control and shown as the mean ± SEM of three independent experiments. Ten images were captured of each group in the independent experiment. *p < 0.05 and ***p < 0.001 versus vehicle (Veh), Kruskal-Wallis one-way analysis of variance by ranks test.
Figure 6
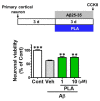
Effects of platycodigenin (PLA) on Aβ25-35-induced neuronal death. Primary cultured cortical neurons were cultured for 3 d and treated with PLA (1 and 10 μM) and/or Aβ25-35 (10 μM) for another 3 d. The neuronal viability was determined by CCK8 analysis. The data are normalized to the control and shown as the mean ± SEM of three independent experiments. Each group has five replicates in the independent experiment. **p < 0.01 and ***p < 0.001 versus vehicle (Veh), Kruskal-Wallis one-way analysis of variance by ranks test.
Figure 7
Effects of platycodigenin (PLA) on neurite outgrowth. Primary cultured cortical neurons were cultured for 2 d following treated with PLA (0.01–10 μM) or control (Cont, 0.1% DMSO) for another 4 d. The neurons were fixed and immunostained for β3-tubulin and MAP2. The lengths of the β3-tubulin positive neurites were measured. (A) Time schedule of the experiments. (B) Quantification of total neurite outgrowth and associated statistics. (C) Representative images of β3-tubulin and MAP2 positive neurites. Scale bar, 100 μm. The data are shown as the mean ± SEM of three independent experiments. Ten images were captured of each group in the independent experiment. *p < 0.05 and **p < 0.01 versus control (Cont), one-way analysis of variance and Dunnett’s post hoc test.
Figure 8
Effects of platycodigenin (PLA) on Aβ25-35-induced neuritic atrophy. Primary cultured cortical neurons were cultured for 3 d and pre-treated with Aβ25-35 (10 μM) for 3 d, then PLA (1 and 10 μM) or control (Cont, 0.1% DMSO) were treated to neurons for another 4 d. The neurons were fixed and immunostained for β3-tubulin. The lengths of the β3-tubulin positive neurites were measured. (A) Time course of the experiments. (B) Quantification of total neurite outgrowth and associated statistics. (C) Representative images of β3-tubulin-positive neurites in Aβ25-35 treated group. Scale bar, 100 μm. The data are shown as the mean ± SEM of three independent experiments. Ten images were captured of each group in the independent experiment. *p < 0.05, **p < 0.01 and ***p < 0.001 versus vehicle (Veh), one-way analysis of variance and Dunnett’s post hoc test.
Similar articles
- Oxymatrine inhibits neuroinflammation byRegulating M1/M2 polarization in N9 microglia through the TLR4/NF-κB pathway.
Wang XL, Chen F, Shi H, Zhang M, Yan L, Pei XY, Peng XD. Wang XL, et al. Int Immunopharmacol. 2021 Nov;100:108139. doi: 10.1016/j.intimp.2021.108139. Epub 2021 Sep 10. Int Immunopharmacol. 2021. PMID: 34517275 - Candesartan modulates microglia activation and polarization via NF-κB signaling pathway.
Qie S, Ran Y, Lu X, Su W, Li W, Xi J, Gong W, Liu Z. Qie S, et al. Int J Immunopathol Pharmacol. 2020 Jan-Dec;34:2058738420974900. doi: 10.1177/2058738420974900. Int J Immunopathol Pharmacol. 2020. PMID: 33237822 Free PMC article. - Polysaccharide from Schisandra chinensis acts via LRP-1 to reverse microglia activation through suppression of the NF-κB and MAPK signaling.
Xu M, Wang J, Zhang X, Yan T, Wu B, Bi K, Jia Y. Xu M, et al. J Ethnopharmacol. 2020 Jun 28;256:112798. doi: 10.1016/j.jep.2020.112798. Epub 2020 Apr 3. J Ethnopharmacol. 2020. PMID: 32251761 - Microglia polarization in nociplastic pain: mechanisms and perspectives.
Atta AA, Ibrahim WW, Mohamed AF, Abdelkader NF. Atta AA, et al. Inflammopharmacology. 2023 Jun;31(3):1053-1067. doi: 10.1007/s10787-023-01216-x. Epub 2023 Apr 17. Inflammopharmacology. 2023. PMID: 37069462 Free PMC article. Review. - Microglial polarization: novel therapeutic mechanism against Alzheimer's disease.
Yao K, Zu HB. Yao K, et al. Inflammopharmacology. 2020 Feb;28(1):95-110. doi: 10.1007/s10787-019-00613-5. Epub 2019 Jul 1. Inflammopharmacology. 2020. PMID: 31264132 Review.
Cited by
- The bioactive compounds, beneficial medicinal properties, and biotechnological prospects of Fomitopsis: a comprehensive overview.
Karunarathna SC, Patabendige NM, Kumla J, Hapuarachchi KK, Suwannarach N. Karunarathna SC, et al. Front Cell Infect Microbiol. 2025 Apr 22;15:1534617. doi: 10.3389/fcimb.2025.1534617. eCollection 2025. Front Cell Infect Microbiol. 2025. PMID: 40330023 Free PMC article. Review. - Overexpression of TGFBR3 Aggravates Cognitive Impairment and Neuroinflammation by Promoting Microglia M1 Polarization in the APP/PS1 Mouse Model of Alzheimer's Disease.
Song H, Xia M, Zhao P, Yang J, Yu W. Song H, et al. Mol Neurobiol. 2025 Jun;62(6):7706-7722. doi: 10.1007/s12035-025-04731-w. Epub 2025 Feb 10. Mol Neurobiol. 2025. PMID: 39930283 - The Impact of Microglia on Neurodevelopment and Brain Function in Autism.
Luo Y, Wang Z. Luo Y, et al. Biomedicines. 2024 Jan 17;12(1):210. doi: 10.3390/biomedicines12010210. Biomedicines. 2024. PMID: 38255315 Free PMC article. Review. - Non-Coding RNA in Microglia Activation and Neuroinflammation in Alzheimer's Disease.
He C, Li Z, Yang M, Yu W, Luo R, Zhou J, He J, Chen Q, Song Z, Cheng S. He C, et al. J Inflamm Res. 2023 Sep 21;16:4165-4211. doi: 10.2147/JIR.S422114. eCollection 2023. J Inflamm Res. 2023. PMID: 37753266 Free PMC article. Review. - Thymosin β4 reverses phenotypic polarization of glial cells and cognitive impairment via negative regulation of NF-κB signaling axis in APP/PS1 mice.
Wang M, Feng LR, Li ZL, Ma KG, Chang KW, Chen XL, Yang PB, Ji SF, Ma YB, Han H, Ruganzua JB, Yang WN, Qian YH. Wang M, et al. J Neuroinflammation. 2021 Jun 28;18(1):146. doi: 10.1186/s12974-021-02166-3. J Neuroinflammation. 2021. PMID: 34183019 Free PMC article.
References
MeSH terms
Substances
LinkOut - more resources
Full Text Sources
Research Materials
Miscellaneous


