C9orf72 in myeloid cells suppresses STING-induced inflammation - PubMed (original) (raw)
. 2020 Sep;585(7823):96-101.
doi: 10.1038/s41586-020-2625-x. Epub 2020 Aug 19.
Jacqueline Gire O'Rourke 1 2, Alberto Yáñez 3 4, Janet L Markman 5, Ritchie Ho 2, Xinchen Wang 6, Shuang Chen 5, Deepti Lall 1 2, Mengyao Jin 5 7, A K M G Muhammad 1 2, Shaughn Bell 1 2, Jesse Landeros 1, Viviana Valencia 1, Matthew Harms 6, Moshe Arditi 5, Caroline Jefferies 5 7, Robert H Baloh 8 9 10
Affiliations
- PMID: 32814898
- PMCID: PMC7484469
- DOI: 10.1038/s41586-020-2625-x
C9orf72 in myeloid cells suppresses STING-induced inflammation
Madelyn E McCauley et al. Nature. 2020 Sep.
Abstract
Amyotrophic lateral sclerosis (ALS) and frontotemporal dementia (FTD) are neurodegenerative disorders that overlap in their clinical presentation, pathology and genetic origin. Autoimmune disorders are also overrepresented in both ALS and FTD, but this remains an unexplained epidemiologic observation1-3. Expansions of a hexanucleotide repeat (GGGGCC) in the C9orf72 gene are the most common cause of familial ALS and FTD (C9-ALS/FTD), and lead to both repeat-containing RNA and dipeptide accumulation, coupled with decreased C9orf72 protein expression in brain and peripheral blood cells4-6. Here we show in mice that loss of C9orf72 from myeloid cells alone is sufficient to recapitulate the age-dependent lymphoid hypertrophy and autoinflammation seen in animals with a complete knockout of C9orf72. Dendritic cells isolated from C9orf72-/- mice show marked early activation of the type I interferon response, and C9orf72-/- myeloid cells are selectively hyperresponsive to activators of the stimulator of interferon genes (STING) protein-a key regulator of the innate immune response to cytosolic DNA. Degradation of STING through the autolysosomal pathway is diminished in C9orf72-/- myeloid cells, and blocking STING suppresses hyperactive type I interferon responses in C9orf72-/- immune cells as well as splenomegaly and inflammation in C9orf72-/- mice. Moreover, mice lacking one or both copies of C9orf72 are more susceptible to experimental autoimmune encephalitis, mirroring the susceptibility to autoimmune diseases seen in people with C9-ALS/FTD. Finally, blood-derived macrophages, whole blood and brain tissue from patients with C9-ALS/FTD all show an elevated type I interferon signature compared with samples from people with sporadic ALS/FTD; this increased interferon response can be suppressed with a STING inhibitor. Collectively, our results suggest that patients with C9-ALS/FTD have an altered immunophenotype because their reduced levels of C9orf72 cannot suppress the inflammation mediated by the induction of type I interferons by STING.
Conflict of interest statement
Competing interests
The authors declare no competing interests.
Figures
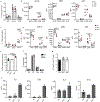
Extended Data Fig. 1|. Dendritic cells and T cells develop normally in _C9orf72_−/− mice, but show markers of immune activation and inflammatory cytokine production from a young age.
a. Percentage of dendritic cell (DC) populations from total splenocytes of 8-week old mice (n=5). b. MFI measured via flow cytometry for MHCII and co-stimulatory molecules (CD80, CD86, and CD40) of three splenic DC populations (CD11b, CD8a, and pDC) from 8-week old mice (n=5). c. Percentage of DC populations from total splenocytes of 8-month old mice (n=6). d. MFI measured via flow cytometry for MHCII and co-stimulatory molecules of splenic DC populations of 8-month old mice (n=6). e. Intracellular TNFα staining of splenic DCs from 10-week old mice after LPS (100ng/ml) stimulation (n=3). f. Quantification of double negative (DN), double positive (DP) and single positive CD4 and CD8 T cell populations in thymus of 8-week old mice (n=3). g. Percentage of Foxp3+ CD4 T cells in the spleen of 8 week old mice (n=3) showing no change in T regulatory cell populations. h. ELISA of supernatants collected from isolated CD4 T cells of 6-month old mice from spleen after anti-CD3/anti-CD28 treatment for 72 hours, graphs duplicate measurements from two independent experiments. a-h. One-way ANOVA. e,h,i. Data are presented as mean values +/− SEM. h. Data are presented as mean values +/− SD.
Extended Data Fig. 2|. Profiling of splenocytes from myeloid specific deletion of C9orf72 via Cx3cr1-Cre.
a. Proportion of immune cell populations in 12-month old C9orf72 fl/fl:Cx3cr1Cre mice. b. Proportion of splenic DC populations in 5-month old C9orf72 fl/fl:Cx3cr1Cre mice (n=7). c. C9orf72 fl/fl:Cx3cr1Cre CD11b splenic DCs have increased MFI of CD86 in 5-month old mice (n=4). d. MFI of splenic DC MHCII and co-stimulatory molecules in 5-month old C9orf72 fl/fl:Cx3cr1Cre mice (n=7). Unpaired, two-tailed Students t-test. b,c. Data are presented as mean values +/− SEM.
Extended Data Fig. 3|. Immune profiling of C9orf72 fl/fl:LysMCre mice.
a. Gross images of splenomegaly in C9orf72 fl/fl:LysMCre (left) Spleen weights of C9orf72 fl/fl:LysMCre (mg) normalized to body weight (g) at 5 months (right) (n=4). b. Proportion of splenic DC populations in 5-month old C9orf72 fl/fl:LysMCre mice (n=4) c. Proportion of splenic DC populations in 12-month old C9orf72 fl/fl:LysMCre mice (n=4). d. MFI of splenic DC MHCII and co-stimulatory molecules in 5-month old C9orf72 fl/fl:LysMCre mice (n=4). e. MFI measured via flow cytometry for MHCII and co-stimulatory molecules of splenic DC populations of 12-month old C9orf72 fl/fl:LysMCre mice (n=4). f. Percentage of CD4 and CD8 T cells in splenocytes. g. CD4 T cell and h. CD8 T cell activation states in 5-month of C9orf72 fl/fl:LysMCre mice. i. Percentage of CD4 and CD8 T cells in splenocytes in 12-month old mice. j. CD4 T cell and k. CD8 T cell activation states in 12-month old C9orf72 fl/fl:LysMCre mice (n=4). Unpaired, two-tailed Students t-test. a-c. Data are presented as mean values +/− SEM.
Extended Data Fig. 4|. RNA-seq values for type I interferon stimulated genes in different immune populations of total body versus myeloid cell specific deletion of C9orf72.
a. RNA-sequencing of CD11b cells (a) and B cells (b) from wildtype (WT; n=4), total knockout (C9(−/−);n=3) and C9orf72 fl/fl:Cx3cr1Cre (n=4) mice, similar to that observed in dendritic cells of the total body nulls (Fig 2), showing activation of ISGs. T cells from the same data set are shown in main Fig 1. Two-way ANOVA. Data are presented as mean values +/− SEM.
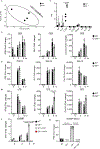
Extended Data Fig. 5|. RNA-seq of C9orf72 deficient DCs, ISG responses in BMDM to TLR agonists, and amelioration of type I IFN responses by deleting STING.
a. PCA plot of RNA sequencing of freshly isolated splenic classical DCs from 10-week old mice (n=4). b. TPM of indicated cytokines and inflammatory genes (WT n=4, C9(−/−) n=4 biologically independent samples). c-e. qRT-PCR of Ifnβ, Mx1 and Cxcl10 in WT and C9(−/−) BMDMs after stimulation of c. CpG, d. Poly IC and e. LPS (representative of 3 experiments) f. STING antagonist H151 blocks the hyperactive ISG response to cGAMP stimulation (representative of 3 experiments). g. qRT-PCR of IFNβ in total BMDMs of WT, Gt(−/−), C9(−/−) and C9(−/−):Gt(−/−) mice after cGAMP stimulation. Representative of 3 independent experiments. b-e. Unpaired, two-tailed t-test. f,g. One-way ANOVA. b. Data are presented as mean values +/− SEM. c-g. Data are presented as mean values +/− SD.
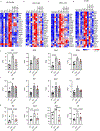
Extended Data Fig. 6|. Deletion of STING mitigates the elevated type I IFN response signature in _C9orf72_−/− immune cells.
a. Heat maps of ISGs from RNA-sequencing of isolated splenocyte populations from 3 month old animals. Cell types are indicated and included a. CD11b myeloid cells, b. CD4 T cells, c. CD8 T cells and d. B cells from wildtype (WT), C9orf72 knockouts (C9(−/−)) and C9orf72:STING double knockout (C9(−/−)/Gt(−/−)) mice. e-g. TPM values of indicated ISGs in e. CD4 T cells (WT n=4), C9orf72 knockouts (C9(−/−)n=3) and C9orf72:STING double knockout (C9(−/−)/Gt(−/−)n=4), f. CD8 T cells(WT n=4), C9orf72 knockouts (C9(−/−)n=3) and C9orf72:STING double knockout (C9(−/−)/Gt(−/−)n=4) and g. B cells (WT n=4), C9orf72 knockouts (C9(−/−)n=3) and C9orf72:STING double knockout (C9(−/−)/Gt(−/−)n=4). Deletion of STING showed marked rescue of the ISG expression across all cell types. e-g. Two-way ANOVA. e-g. Data are presented as mean values +/− SEM.
Extended Data Fig. 7|. Activation markers of splenocyte populations in wildtype (WT), C9orf72−/− (C9(−/−)) and STING knockout (Gt(−/−) mice.
a, b. Flow cytometry of splenic CD11c co-stimulatory markers in 3-month old WT (n=4), C9(−/−) (n=5) and C9(−/−)/Gt(−/−) (n=4) mice. c. RNA-sequencing of splenic CD11b cells in 3-month old WT (n=4), C9(−/−) (n=3) and C9(−/−)/Gt(−/−) (n=4) mice. d. Flow cytometry of splenic CD4 T cells and e. CD8 T cells of 3-month old mice. One-way ANOVA. a,b,d,e. Data are presented as mean values +/− SEM.
Extended Data Fig. 8 |. _C9orf72_−/− T cells show increased activation and markers of Th1 polarization.
Heat map of RNA-sequencing data from isolated CD4 T cells (a), CD8 T cells (b), and B cells (c) from spleens of 3 month old WT(n=4) and C9(−/−) (n=3) mice. Shown are markers of d. Th1 e. Th2 and f. Th17 polarization genes of CD4 T cells. Two-way ANOVA. d-f. Data are presented as mean values +/− SEM
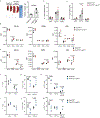
Extended Data Fig. 9|. _C9orf72_−/− mice are more susceptible to EAE than wildtype mice and increased infiltration of Th1 polarized T cells into nervous tissue.
a. Representative luxol fast blue (LFB) staining of spinal cord of WT (n=3), C9(+/−)(n=3) and C9(−/−) (n=3) mice. b. Representative H&E staining of spinal cords from WT (n=3), C9(+/−) (n=3) and C9(−/−) (n=3) mice at end stage. c. Iba1 staining of spinal cord of indicated genotypes (n=3). d. Splenic C9(−/−) CD4 and e. CD8 T cells produce increased levels of IFNγ during pre-onset (day 9) (WT n=4, C9(+/−) n=4), C9(−/−) n=3 biologically independent samples) and peak (day 15) (WT n=3, C9(+/−) n=3, C9(−/−) n=3 biologically independent samples) of EAE f. Total number of CD3+ T cells g. IFNγ + CD4 T cells, h. IL17+ CD4 T cells and i. IFNγ+IL17+ CD4 T cells in whole brain of WT (n=2), C9(+/−) (n=3) and C9(−/−) (n=3) mice during peak (day 15) of disease. f-i. One-way ANOVA. f-i. Data are presented as mean values +/− SEM.
Extended Data Fig. 10|. _C9orf72_−/− mice resistant to B16 melanoma tumors show an enhanced cytotoxic T cell response.
a. Percent CD44+ CD4 T cells (left) and CD8 T cells (right) in the lung of WT (n=2), C9(+/−) (n=3) and C9(−/−) (n=3) mice day 14 of B16 melanoma challenge. b. Percent of naïve CD4 T cells and c. Memory CD4 T cells in the spleens of WT, C9(+/−) and C9(−/−) mice with and without B16 inoculation (n=5). d. Percent of naïve CD8 T cells, e. memory CD8 T cells and f. effector memory CD8 T cells in the spleens of wildtype, C9(+/−) and C9(−/−) mice with and without B16 inoculation (n=5). One-way ANOVA. Data are presented as mean values +/− SEM.
Fig 1. |. Dendritic cell development and T cell activation in young and aged _C9orf72_−/− mice.
a. Mean fluorescent intensity (MFI) of CD86 in CD11c+ splenic dendritic cells in young (n=5) and (b) aged mice (n=6). c. Flow cytometric analysis of naïve (CD62L+), memory (CD62L+, CD44+) and effector memory (CD44+) CD4 T cells and CD8 T cells for 8 week (n=5) and d. 8 month old animals (n=6). e. Gross images of splenomegaly in _C9orf72_-Cx3cr1 Cre mice at 5 months (left). Spleen weights (mg) normalized to body weight (g) at 5 months (right) (n=7). f. C9orf72-Cx3cr1Cre mice have decreased naïve CD4 and CD8 T cells with an increase in CD4 memory and CD8 effector memory T cells (n=7). g. Gene set enrichment analysis (GSEA) of significantly upregulated pathways in CD8 T cells (grey) and CD4 T cells (striped) of C9orf72-Cx3cr1Cre mice vs wild-type (WT) at 3 months (FDR < 0.05) (n=4). h,i. TPM values from RNA seq showing non-cell autonomous elevation of interferon signature genes (ISGs) in CD8 (WT n=4, C9(−/−) n=3, C9orf72fl/fl;Cx3CR1Cre n=3) and CD4 T cells (WT n=4, C9(−/−) n=3, C9orf72fl/fl;Cx3CR1Cre n=4) in C9orf72-Cx3cr1Cre mice. a-d, f. One-way ANOVA, e. Unpaired, two tailed Students t-test. h,i. Two-way ANOVA. a-f,h,i. Data are presented as mean values +/− SEM. Each dot represents one mouse.
Fig 2. |. Loss of C9orf72 in myeloid cells drives increased type I interferon production through STING.
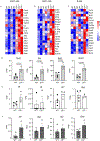
Heat map (max-min normalized) of IFN-response a. or NF-kB-response genes b. in C9(−/−) vs. WT splenic cDCs via RNA-seq. c. qRT-PCR of IFNβ, d. Mx1 and e. Cxcl10 in BMDMs of WT and C9(−/−) mice following cGAMP (5μg/ml) stimulation (technical replicates representative of 4 biological replicates). f. Western blot of BMDMs stimulated with cGAMP (10μg/ml) for 0, 6, 9, 24, or 24 hours+Bafilomycin showing delayed STING degradation in C9(−/−) vs WT (representative of 4 experiments). *Molecular weight marker visualized (see Sup.Fig.1). g. Western blot of phospho-365 STING at (0h) vs. overnight (24h) cGAMP (10μg/ml) treatment on WT vs C9(−/−) BMDMs (left). Quantification of pSTING (right) from n=3 biological replicate experiments. h. BMDMs stimulated with cGAMP (10μg/ml) for 0, 6, 24, or 24 hours + Bafilomycin showing LC3-II (top blot, arrow) in WT vs C9(−/−) BMDM, with tubulin loading control (bottom blot) (representative of 4 biological replicates). i. qRT-PCR of IFNβ in BMDMs for WT and C9(−/−) with and without STING antagonist H151 (1μM) following cGAMP stimulation (technical replicates representative of 3 biological replicates). j. Spleen weight (mg) normalized to body weight (g) at 8–10 weeks (n=7) (left) and gross representative images (right). k. qRT-PCR of Trem2 and IL10 in total splenocytes of WT (n=6), Gt(−/−) (n=3), C9(−/−) (n=5) and C9(−/−):Gt(−/−) (n=6) mice**. l.** RNA-seq of interferon response gene expression from splenic CD11b+ cells in 3 month old WT (n=4), C9(−/−) (n=3), and C9(−/−)/Gt(−/−) mice (n=4). Two-way ANOVA. c-e,k. Unpaired, two tailed Students t-test. i,j,l. One-way ANOVA. e-g,k. Data are presented as mean values +/− SD. i,l-m. Data are presented as mean values +/− SEM. g,j-l. Each dot represents one mouse. For gel source data, see Supplementary Figure 1.
Fig 3. |. _C9orf72_−/− mice are more susceptible to experimental autoimmune encephalomyelitis (EAE) and have increased antitumor immunity.
a. EAE clinical score and b. Weight (g) over the course of EAE on WT (n=13), C9(+/−) (n=13), C9(−/−) (n=10) mice. c. Representative images of lungs from WT, C9(+/−) and C9(−/−) mice 14 days after B16 inoculation. d. C9(−/−) mice have decreased number of tumor colonies (WT n=8, C9(+/−) n=8, C9(−/−) n=9) and e. melanin content after inoculation with B16 melanoma cells for 14 days (WT n=6, C9(+/−) n=8, C9(−/−) n=9). One-way ANOVA. a, b, d, and e. Data are presented as mean values +/− SEM. d,e. Each dot represents one mouse.
Fig 4. |. C9orf72 repeat expansion ALS patients have an enhanced type I IFN signature in peripheral myeloid cells that can be suppressed by a STING antagonist.
a. GSEA of RNA-seq from MDM between C9ALS (n=5) vs. sALS (n=5) patients (FDR < 0.05). b. RPKM of type I IFN stimulated gene expression in C9ALS MDMs compared to sALS and normal controls (NC) (n=5). One-way ANOVA. c. qRT-PCR validation of IFN stimulated genes in (b) (n=3). One-way ANOVA. d. Whole blood RNA-seq from C9ALS patients (n=20) showing decreased C9orf72 expression compared to sALS patients (n=259) sALS (left box): n=259, min = −0.722, max = 0.697. Whiskers = [−0.562, 0.625], box = [−0.147, 0.174], median = 0.0214. C9ALS (right box), n=20, min = −0.779, max=0.355, Whiskers = [−0.779, 0.211], Box = [−0.551, −0.215], median = −0.425. e. Upregulated pathways from RNA-seq of whole blood between C9ALS vs sALS (FDR < 0.05). f. Upregulated inflammatory pathways of cerebellar tissue between C9ALS (n=8) and sALS (n=10) patients (FDR < 0.05). g. qRT-PCR of IFNβ production from microglia isolated from WT (n=4) and C9orf72−/− (n=4) mouse brain after cGAMP stimulation. Unpaired, one-tailed Student’s t-test. h. qRT-PCR of ISGs MX1 and STAT1 in sALS and C9ALS patients PBMCs with and without H151 STING inhibitor (1μM) (n=3). Paired, one-tailed Students t-test. i. Table of TPM values of indicated interferon stimulated genes from RNA-sequencing of MDM’s from two C9orf72 patients with and without H151 STING inhibitor (6 hours). Blue=percent decreased, red=percent increased. b, c, g, and h. Data are presented as mean values +/− SEM. Each dot represents one sample.
Comment in
- Neurodegenerative gene's function is not all about those bases.
Gautier O, Gitler AD. Gautier O, et al. Nature. 2020 Sep;585(7823):34-35. doi: 10.1038/d41586-020-02382-6. Nature. 2020. PMID: 32814910 No abstract available.
Similar articles
- Stable transgenic C9orf72 zebrafish model key aspects of the ALS/FTD phenotype and reveal novel pathological features.
Shaw MP, Higginbottom A, McGown A, Castelli LM, James E, Hautbergue GM, Shaw PJ, Ramesh TM. Shaw MP, et al. Acta Neuropathol Commun. 2018 Nov 19;6(1):125. doi: 10.1186/s40478-018-0629-7. Acta Neuropathol Commun. 2018. PMID: 30454072 Free PMC article. - Therapeutic reduction of GGGGCC repeat RNA levels by hnRNPA3 suppresses neurodegeneration in Drosophila models of C9orf72-linked ALS/FTD.
Taminato T, Takeuchi T, Ueyama M, Mori K, Ikeda M, Mochizuki H, Nagai Y. Taminato T, et al. Hum Mol Genet. 2023 May 5;32(10):1673-1682. doi: 10.1093/hmg/ddac298. Hum Mol Genet. 2023. PMID: 36611007 - Different CSF protein profiles in amyotrophic lateral sclerosis and frontotemporal dementia with C9orf72 hexanucleotide repeat expansion.
Barschke P, Oeckl P, Steinacker P, Al Shweiki MR, Weishaupt JH, Landwehrmeyer GB, Anderl-Straub S, Weydt P, Diehl-Schmid J, Danek A, Kornhuber J, Schroeter ML, Prudlo J, Jahn H, Fassbender K, Lauer M, van der Ende EL, van Swieten JC, Volk AE, Ludolph AC, Otto M; German FTLD consortium. Barschke P, et al. J Neurol Neurosurg Psychiatry. 2020 May;91(5):503-511. doi: 10.1136/jnnp-2019-322476. Epub 2020 Mar 4. J Neurol Neurosurg Psychiatry. 2020. PMID: 32132225 - Synaptic dysfunction and altered excitability in C9ORF72 ALS/FTD.
Starr A, Sattler R. Starr A, et al. Brain Res. 2018 Aug 15;1693(Pt A):98-108. doi: 10.1016/j.brainres.2018.02.011. Epub 2018 Feb 14. Brain Res. 2018. PMID: 29453960 Free PMC article. Review. - Molecular Mechanisms of Neurodegeneration Related to C9orf72 Hexanucleotide Repeat Expansion.
Babić Leko M, Župunski V, Kirincich J, Smilović D, Hortobágyi T, Hof PR, Šimić G. Babić Leko M, et al. Behav Neurol. 2019 Jan 15;2019:2909168. doi: 10.1155/2019/2909168. eCollection 2019. Behav Neurol. 2019. PMID: 30774737 Free PMC article. Review.
Cited by
- Phase separation in immune regulation and immune-related diseases.
Huang N, Dong H, Shao B. Huang N, et al. J Mol Med (Berl). 2022 Oct;100(10):1427-1440. doi: 10.1007/s00109-022-02253-9. Epub 2022 Sep 9. J Mol Med (Berl). 2022. PMID: 36085373 Free PMC article. Review. - C9orf72 regulates the unfolded protein response and stress granule formation by interacting with eIF2α.
Zheng W, Wang K, Wu Y, Yan G, Zhang C, Li Z, Wang L, Chen S. Zheng W, et al. Theranostics. 2022 Oct 17;12(17):7289-7306. doi: 10.7150/thno.76138. eCollection 2022. Theranostics. 2022. PMID: 36438488 Free PMC article. - The prognostic value of systematic genetic screening in amyotrophic lateral sclerosis patients.
He D, Liu Y, Dong S, Shen D, Yang X, Hao M, Yin X, He X, Li Y, Wang Y, Liu M, Wang J, Chen X, Cui L. He D, et al. J Neurol. 2024 Mar;271(3):1385-1396. doi: 10.1007/s00415-023-12079-1. Epub 2023 Nov 19. J Neurol. 2024. PMID: 37980296 - C9orf72 deficiency promotes microglial-mediated synaptic loss in aging and amyloid accumulation.
Lall D, Lorenzini I, Mota TA, Bell S, Mahan TE, Ulrich JD, Davtyan H, Rexach JE, Muhammad AKMG, Shelest O, Landeros J, Vazquez M, Kim J, Ghaffari L, O'Rourke JG, Geschwind DH, Blurton-Jones M, Holtzman DM, Sattler R, Baloh RH. Lall D, et al. Neuron. 2021 Jul 21;109(14):2275-2291.e8. doi: 10.1016/j.neuron.2021.05.020. Epub 2021 Jun 15. Neuron. 2021. PMID: 34133945 Free PMC article. - Myeloid and lymphoid expression of C9orf72 regulates IL-17A signaling in mice.
Limone F, Couto A, Wang JY, Zhang Y, McCourt B, Huang C, Minkin A, Jani M, McNeer S, Keaney J, Gillet G, Gonzalez RL, Goodman WA, Kadiu I, Eggan K, Burberry A. Limone F, et al. Sci Transl Med. 2024 Jan 31;16(732):eadg7895. doi: 10.1126/scitranslmed.adg7895. Epub 2024 Jan 31. Sci Transl Med. 2024. PMID: 38295187 Free PMC article.
References
Publication types
MeSH terms
Substances
Grants and funding
- R01 NS097545/NS/NINDS NIH HHS/United States
- T32 GM118288/GM/NIGMS NIH HHS/United States
- 1R21AI126368-01/NH/NIH HHS/United States
- R01 NS069669/NS/NINDS NIH HHS/United States
- R21 AI126368/AI/NIAID NIH HHS/United States
- NS069669/NH/NIH HHS/United States
LinkOut - more resources
Full Text Sources
Other Literature Sources
Molecular Biology Databases
Research Materials
Miscellaneous
