Multilineage Differentiation Potential of Human Dental Pulp Stem Cells-Impact of 3D and Hypoxic Environment on Osteogenesis In Vitro - PubMed (original) (raw)
Multilineage Differentiation Potential of Human Dental Pulp Stem Cells-Impact of 3D and Hypoxic Environment on Osteogenesis In Vitro
Anna Labedz-Maslowska et al. Int J Mol Sci. 2020.
Abstract
Human dental pulp harbours unique stem cell population exhibiting mesenchymal stem/stromal cell (MSC) characteristics. This study aimed to analyse the differentiation potential and other essential functional and morphological features of dental pulp stem cells (DPSCs) in comparison with Wharton's jelly-derived MSCs from the umbilical cord (UC-MSCs), and to evaluate the osteogenic differentiation of DPSCs in 3D culture with a hypoxic microenvironment resembling the stem cell niche. Human DPSCs as well as UC-MSCs were isolated from primary human tissues and were subjected to a series of experiments. We established a multiantigenic profile of DPSCs with CD45-/CD14-/CD34-/CD29+/CD44+/CD73+/CD90+/CD105+/Stro-1+/HLA-DR- (using flow cytometry) and confirmed their tri-lineage osteogenic, chondrogenic, and adipogenic differentiation potential (using qRT-PCR and histochemical staining) in comparison with the UC-MSCs. The results also demonstrated the potency of DPSCs to differentiate into osteoblasts in vitro. Moreover, we showed that the DPSCs exhibit limited cardiomyogenic and endothelial differentiation potential. Decreased proliferation and metabolic activity as well as increased osteogenic differentiation of DPSCs in vitro, attributed to 3D cell encapsulation and low oxygen concentration, were also observed. DPSCs exhibiting elevated osteogenic potential may serve as potential candidates for a cell-based product for advanced therapy, particularly for bone repair. Novel tissue engineering approaches combining DPSCs, 3D biomaterial scaffolds, and other stimulating chemical factors may represent innovative strategies for pro-regenerative therapies.
Keywords: biomaterials; dental pulp stem cells; osteogenesis; regenerative medicine; stem cells; tissue engineering.
Conflict of interest statement
The authors declare no conflict of interest.
Figures
Figure 1
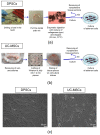
Isolation procedure and morphology of dental pulp stem cells (DPSCs) and umbilical cord Wharton’s jelly-derived mesenchymal stem/stromal cells (UC-MSCs). (a) Isolation of DPSCs from pulp tissue. The upper part of the tooth was drilled and the dental pulp was extracted. The dental pulp was enzymatically digested by a mixture of collagenase I and dispase. The isolated cells and tissue sections were seeded onto cell culture plates in a complete cell culture medium. On day 10 post-seeding, non-adherent cells and tissue pieces were removed. (b) Isolation of UC-MSCs from Wharton’s jelly. The umbilical cord was washed with PBS to remove residual cord blood, and arteries and vein were further dissected. Wharton’s Jelly tissue was cut into 12 mm pieces and placed on the tissue culture dishes in a complete cell culture medium. On day five post-seeding, non-adherent cells and tissue pieces were removed. (c) Representative images of the morphology of DPSCs (left) and UC-MSCs (right). Scale bars: 50 µm.
Figure 2
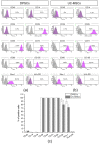
Antigenic profile of DPSCs and UC-MSCs with flow cytometry. Expression of MSC-negative markers (D45, CD14, CD34), MSC- positive markers (CD29, CD44, CD73, CD90, CD105, Stro-1), and HLA-DR antigen on DPSCs and UC-MSCs. (a) Representative histograms of the expression of analysed antigens on DPSCs. (b) Representative histograms of the expression of analysed antigens on UC-MSCs. The peaks of unstained cells (grey) were overlaid with the peak for analysed antigen (violet). (c) Quantitative data representing the percentage content of DPSCs or UC-MSCs positive for analysed antigens. Results are presented as mean ± SD, n = 3.
Figure 3
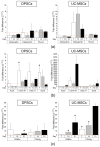
Comparison of tri-lineage differentiation potential of DPSCs and UC-MSCs by real-time RT-PCR. (a) Quantitative analysis of mRNA expression for osteogenesis related genes (osteocalcin, osteopontin, Runx2) in DPSCs (left) and UC-MSCs (right). (b) Quantitative analysis of mRNA expression for chondrogenesis related genes (Acan, Col10A1, Col2A1, Sox9) in DPSCs (left) and UC-MSCs (right). (c) Quantitative analysis of mRNA expression for adipogenesis related genes (CEBPα, PPARγ) in DPSCs (left) and UC-MSCs (right). Cells were cultured in a StemPro osteogenesis differentiation kit, StemPro chondrogenesis differentiation kit, and StemPro adipogenesis differentiation kit for 7, 14, and 21 days, respectively. Fold differences in expression (2−ddCt) of analysed genes in control cells cultured in standard cell culture medium (undifferentiated) were calculated as 1.0 and marked by a solid line. Graphs present different scales. Results are presented as mean ± standard error of the mean (SEM), n = 3 (every sample prepared for each DPSCs line derived from each donor were run in duplicates); _t_-test, (*) p < 0.05 vs. undifferentiated cells.
Figure 4
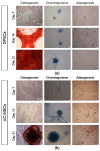
Tri-lineage differentiation potential of DPSCs and UC-MSCs in an in vitro culture demonstrated by histochemical staining. (a) Representative images of DPSCs differentiated into osteoblasts, chondroblasts and adipocytes. (b) Representative images of UC-MSCs differentiated into osteoblasts, chondroblasts, and adipocytes. DPSCs and UC-MSCs were cultured in a StemPro osteogenesis differentiation kit, StemPro chondrogenesis differentiation kit, or StemPro adipogenesis differentiation kit. On days 7, 14, and 21 of differentiation, DPSCs and UC-MSCs were fixed with paraformaldehyde and stained with Alizarin Red S (red staining of calcium phosphate deposits that are a characteristic of osteogenic differentiation), Alcian Blue (blue staining of sulphated proteoglycans that are a characteristic of chondrogenic differentiation) or Oil Red O (brownish red oil droplets that are a characteristic of adipogenic differentiation). Scale bars: 50 µm.
Figure 5
Comparison of cardiomyogenic and endothelial differentiation potential of DPSCs and UC-MSCs by Real-Time PCR. (a) Quantitative analysis of mRNA expression of cardiomyogenesis related genes (Gata-4, Nkx2.5, Myl2c) in DPSCs (left) and UC-MSCs (right). Cells were cultured in DMEM/F12 supplemented with 2% FBS and 10 ng/mL basic fibroblast growth factor (bFGF), 10 ng/mL vascular endothelial growth factor (VEGF) and 10 ng/mL transforming growth factor β1 (TGF-β1) for 7, 14 and 21 days. (b) Quantitative analysis of mRNA expression for endothelial related genes (Gata-2, Tie-2, VE-cadherin) in DPSCs (left) and UC-MSCs (right). Cells were cultured in EGM-2MV endothelial cell growth medium for 7, 14 and 21 days. Fold differences in the expression (2−ddCt) of analysed genes in control cells cultured in standard cell culture medium (undifferentiated) were calculated as 1.0 and marked by a solid line. Graphs present different scales. Results are presented as mean ± SEM, n = 3 (every sample prepared for each DPSCs line from each donor was run in duplicate); _t_-test, p < 0.05 vs. undifferentiated cells.
Figure 6
Cardiomyogenic and endothelial differentiation of DPSCs and UC-MSCs in vitro on day 7. (a) Representative images of cardiomyogenic and endothelial marker expression in DPSCs. (b) Representative images of cardiomyogenic and endothelial marker expression in UC-MSCs. In the case of cardiomyogenic differentiation, cells were cultured in DMEM/F12 supplemented with 2% FBS and 10 ng/mL bFGF, 10 ng/mL VEGF and 10 ng/mL TGF-β1. On day 7, cells were fixed, permeabilized, and stained against intranuclear transcription factor Gata-4 (Alexa Fluor 488, green) and troponin T-C (Alexa Fluor 546, red), whereas nuclei were co-stained with DAPI (blue). In the case of endothelial differentiation, cells were cultured in EGM-2MV. On day 7, cells were fixed, permeabilized, and stained against intranuclear transcription factor Gata-2 (Alexa Fluor 488, green) and VE-cadherin (Alexa Fluor 546, red), whereas nuclei were co-stained with DAPI (blue). Cells were analysed with Leica DMI6000B ver. AF7000 fluorescent microscope. Scale bars: 100 μm.
Figure 7
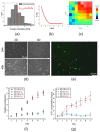
Mechanical properties of the hydrogel matrix and their impact on morphology, proliferation, and metabolic activity of DPSCs. (a) Young’s modulus distributions of hydrogel matrix by AFM. (b) Exemplary force curve recorded on the hydrogel. (c) Exemplary elasticity map of peptide hydrogel. (d) Morphology of DPSCs encapsulated in hydrogel (3D) or seeded on the surfaces coated with gelatin (2D) at 24 and 48 h post-seeding. DPSCs were cultured in DMEM/F12 supplemented with 10% FBS and cultured under standard culture conditions (5% CO2, normoxia). (e) Morphology of DPSCs encapsulated in hydrogel (3D culture) on day 4 post-seeding. Cells were stained with fluorescein diacetate and analysed with Leica DMI6000B ver. AF7000 fluorescent microscope to visualize their morphology. (f) The proliferation of DPSCs in 2D and 3D cultures in the environment containing about 18% or 2% O2 analysed every 24 h until day 7. The analyses were conducted using the Cell Counting Kit-8. (g) Metabolic activity of DPSCs in 3D and 2D culture in the environment containing about 18% or 2% O2 measured every 24 h until day 7. The analyses were conducted using the ATP Lite Luminescence assay kit. The results from proliferation and metabolic activity are presented as mean ± SEM, n = 3 (every sample prepared for each DPSCs line from each donor was analysed in triplicate).
Figure 8
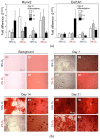
Osteogenic differentiation of DPSCs encapsulated in hydrogel (3D) or seeded on the surface coated with gelatin (2D) cultured in hypoxic (2% O2) or normoxic (about 18% O2) environment. (a) Quantitative analysis of mRNA expression for osteogenesis associated genes (Col1A, Runx2) in DPSCs on days 7, 14, and 21 of differentiation. Fold change in the expression of analysed genes in control cells before differentiation was calculated as 1.0 and marked by a solid line. Results are presented as mean ± SEM, n = 3 (every sample was analysed in duplicate). p < 0.05 (_t_-test). (b) Representative images of DPSCs differentiated into osteoblasts on days 7, 14, and 21 days of differentiation. Panel “Background” contains the representative images of 2D and 3D surfaces (standards plastic dish and hydrogel without cells, respectively) stained with Alizarin Red S solution to visualize background staining (on day 7 post surface preparation). Panels “Day 7”, “Day 14”, “Day 21” demonstrate representative images of DPSCs cultured in StemPro osteogenesis differentiation kit. On days 7, 14 and 21, DPSCs were fixed with paraformaldehyde and stained with Alizarin Red S (red staining of deposits of calcium phosphate is a characteristic for osteogenic differentiation).
Similar articles
- MSCs can be differentially isolated from maternal, middle and fetal segments of the human umbilical cord.
Lim J, Razi ZR, Law J, Nawi AM, Idrus RB, Ng MH. Lim J, et al. Cytotherapy. 2016 Dec;18(12):1493-1502. doi: 10.1016/j.jcyt.2016.08.003. Epub 2016 Oct 7. Cytotherapy. 2016. PMID: 27727016 - Wharton's Jelly Derived-Mesenchymal Stem Cells: Isolation and Characterization.
Ranjbaran H, Abediankenari S, Mohammadi M, Jafari N, Khalilian A, Rahmani Z, Momeninezhad Amiri M, Ebrahimi P. Ranjbaran H, et al. Acta Med Iran. 2018 Jan;56(1):28-33. Acta Med Iran. 2018. PMID: 29436792 - Stem Cells Derived from Dental Tissues.
Aydin S, Şahin F. Aydin S, et al. Adv Exp Med Biol. 2019;1144:123-132. doi: 10.1007/5584_2018_333. Adv Exp Med Biol. 2019. PMID: 30635857 Review. - Mesenchymal stem cells derived from dental tissues vs. those from other sources: their biology and role in regenerative medicine.
Huang GT, Gronthos S, Shi S. Huang GT, et al. J Dent Res. 2009 Sep;88(9):792-806. doi: 10.1177/0022034509340867. J Dent Res. 2009. PMID: 19767575 Free PMC article. Review.
Cited by
- The emerging role of mechanical and topographical factors in the development and treatment of nervous system disorders: dark and light sides of the force.
Bryniarska-Kubiak N, Kubiak A, Lekka M, Basta-Kaim A. Bryniarska-Kubiak N, et al. Pharmacol Rep. 2021 Dec;73(6):1626-1641. doi: 10.1007/s43440-021-00315-2. Epub 2021 Aug 14. Pharmacol Rep. 2021. PMID: 34390472 Free PMC article. Review. - Role of Hypoxia in Mesenchymal Stem Cells from Dental Pulp: Influence, Mechanism and Application.
Ma M. Ma M. Cell Biochem Biophys. 2024 Jun;82(2):535-547. doi: 10.1007/s12013-024-01274-0. Epub 2024 May 7. Cell Biochem Biophys. 2024. PMID: 38713403 Free PMC article. Review. - Modulation of the Dental Pulp Stem Cell Secretory Profile by Hypoxia Induction Using Cobalt Chloride.
Bhandi S, Al Kahtani A, Mashyakhy M, Alsofi L, Maganur PC, Vishwanathaiah S, Testarelli L, Del Giudice A, Mehta D, Vyas N, Patil VR, Raj AT, Patil S. Bhandi S, et al. J Pers Med. 2021 Mar 30;11(4):247. doi: 10.3390/jpm11040247. J Pers Med. 2021. PMID: 33808091 Free PMC article. - Current Strategies and Therapeutic Applications of Mesenchymal Stem Cell-Based Drug Delivery.
Matsuzaka Y, Yashiro R. Matsuzaka Y, et al. Pharmaceuticals (Basel). 2024 May 30;17(6):707. doi: 10.3390/ph17060707. Pharmaceuticals (Basel). 2024. PMID: 38931374 Free PMC article. Review. - Characterization of Biological Properties of Dental Pulp Stem Cells Grown on an Electrospun Poly(l-lactide-_co_-caprolactone) Scaffold.
Bar JK, Kowalczyk T, Grelewski PG, Stamnitz S, Paprocka M, Lis J, Lis-Nawara A, An S, Klimczak A. Bar JK, et al. Materials (Basel). 2022 Mar 3;15(5):1900. doi: 10.3390/ma15051900. Materials (Basel). 2022. PMID: 35269131 Free PMC article.
References
- Dominici M., Le Blanc K., Mueller I., Slaper-Cortenbach I., Marini F.C., Krause D.S., Deans R.J., Keating A., Prockop D.J., Horwitz E.M. Minimal criteria for defining multipotent mesenchymal stromal cells. The International Society for Cellular Therapy position statement. Cytotherapy. 2006;8:315–317. doi: 10.1080/14653240600855905. - DOI - PubMed
- Labovsky V., Hofer E.L., Feldman L., Fernández Vallone V., García Rivello H., Bayes-Genis A., Hernando Insúa A., Levin M.J., Chasseing N.A. Cardiomyogenic differentiation of human bone marrow mesenchymal cells: Role of cardiac extract from neonatal rat cardiomyocytes. Differentiation. 2010;79:93–101. doi: 10.1016/j.diff.2009.10.001. - DOI - PubMed
MeSH terms
Grants and funding
- Symfonia 3 grant number UMO-2015/16/W/NZ4/00071 (to E.Z.-S.)/NATIONAL SCIENCE CENTER
- Strategmed 3 grant number STRATEGMED3/303570/7/NCBR/2017 (to E.Z.-S.)/NATIONAL CENTER FOR RESEARCH AND DEVELOPMENT
- Etiuda 4 grant number UMO-2016/20/T/NZ3/00516 (to A.L.-M.)/NATIONAL SCIENCE CENTER
LinkOut - more resources
Full Text Sources
Research Materials
Miscellaneous
