Radiation Response of Human Cardiac Endothelial Cells Reveals a Central Role of the cGAS-STING Pathway in the Development of Inflammation - PubMed (original) (raw)
Radiation Response of Human Cardiac Endothelial Cells Reveals a Central Role of the cGAS-STING Pathway in the Development of Inflammation
Jos Philipp et al. Proteomes. 2020.
Abstract
Radiation-induced inflammation leading to the permeability of the endothelial barrier may increase the risk of cardiovascular disease. The aim of this study was to investigate potential mechanisms in vitro at the level of the proteome in human coronary artery endothelial cells (HCECest2) that were exposed to radiation doses of 0, 0.25, 0.5, 2.0 and 10 Gy (60Co-γ). Proteomics analysis was performed using mass spectrometry in a label-free data-independent acquisition mode. The data were validated using bioinformatics and immunoblotting. The low- and moderate-dose-irradiated samples (0.25 Gy, 0.5 Gy) showed only scarce proteome changes. In contrast, an activation of DNA-damage repair, inflammation, and oxidative stress pathways was seen after the high-dose treatments (2 and 10 Gy). The level of the DNA damage response protein DDB2 was enhanced early at the 10 Gy dose. The expression of proteins belonging to the inflammatory response or cGAS-STING pathway (STING, STAT1, ICAM1, ISG15) increased in a dose-dependent manner, showing the strongest effects at 10 Gy after one week. This study suggests a connection between the radiation-induced DNA damage and the induction of inflammation which supports the inhibition of the cGAS-STING pathway in the prevention of radiation-induced cardiovascular disease.
Keywords: DDB2; STAT1; cGAS-STING-pathway; data-independent acquisition; endothelial cells; inflammation; ionizing radiation; proteomics.
Conflict of interest statement
The authors declare no conflict of interest.
Figures
Figure 1
The work flow of the study showing the experimental design. Human coronary artery endothelial cells (HCAECs) were irradiated with 0, 0.25, 0.5, 2 or 10 Gy. At 4, 24, 48 h and 1 week, the cells were harvested and analyzed using a data-independent proteomics approach. The proteome changes in all irradiated samples were normalized to the sham-irradiated sample collected at the corresponding time point to investigate the dose-dependent effects. The proteome changes at different time points were normalized to the corresponding sample collected at 4 h.
Figure 2
The alterations in the human coronary artery endothelial cell line (HCECest2) cell proteome with time and radiation dose. (A) The total number of all identified proteins (dark blue), the number of all quantified (q ≤ 0.05) proteins (blue) and the number of significantly differentially regulated (q ≤ 0.05; fold change ±1.3) proteins (light blue) at each time point compared to the 4 h time point are shown. (B) The total number of all identified proteins (light orange), the number of all quantified (q ≤ 0.05) proteins (orange) and the number of significantly differentially regulated (q ≤ 0.05; fold change ±1.3) proteins (dark orange) at each radiation dose compared to the 0 Gy control are shown. (C) Venn diagram illustrating the number of shared deregulated proteins between the three time points at 2 Gy. (D) Venn diagram illustrating the number of shared deregulated proteins between the three time points at 10 Gy. (E) Venn diagram illustrating the number of shared deregulated proteins between the four radiation doses at the 1 week time point. (F) The level of DDB2 (DNA damage-binding protein 2) at different radiation doses 24 h post-exposure is shown. (G) The level of deregulated proteins FDXR (ferredoxin reductase), DDB2, GPX1 (glutathione peroxidase 1), FAS (tumor necrosis factor receptor superfamily member 6), and EIF3 (eukaryotic translation initiation factor 3 subunit E) at different radiation doses 48 h post-exposure is shown. (H) The level of deregulated proteins FDXR, DDB2, GPX1, FAS, and EIF3 at different radiation doses 1 week post-exposure is shown.
Figure 3
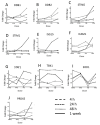
The dose-dependent alteration in the expression of proteins belonging to functionally different groups: DNA repair pathway, inflammatory response, and oxidative stress. (A) The level of DDB1 (DNA damage-binding protein 1), (B) DDB2 (DNA damage-binding protein 2), (C) STING (stimulator of interferon genes protein), (D) STIM1 (stromal interaction molecule 1), (E) ISG15 (ubiquitin-like protein ISG15), (F) ICAM1 (intercellular adhesion molecule 1), (G) STAT1 (signal transducer and activator of transcription 1), (H) TBK1 (serine/threonine-protein kinase TBK1), (I) SOD1 (superoxide dismutase (Cu–Zn)), and (J) PRDX5 (peroxiredoxin-5, mitochondrial) is shown after 4, 24, 48 h, and 1 week.
Figure 4
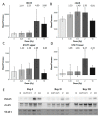
Immunoblot verification of the protein changes in the irradiated HCECest2 cells 1 week after radiation exposure. (A) The expression of ISG15 (ubiquitin-like protein ISG15), (B) cGAS (cyclic GMP-AMP synthase), (C) STAT1 (signal transducer and activator of transcription 1) upper band, (D) STAT1 lower band is shown. The bars represent the relative expression after correction for background and normalization to Ponceau. The error bars are calculated as the SEM (t test; * p < 0.05; n = 3). (E) The visualization of protein bands is shown.
Figure 5
Interaction analysis of the cGAS-STING network using the STRING-db (string-db.org). Direct interactions between the proteins identified in HCECest2 cells one week after irradiation using proteomics or immunoblotting are shown in blue, predicted interactions (one step relaxation in STRING-db) are shown in red. Significantly differentially regulated proteins and the direction of deregulation are shown by red arrows. The significance of deregulation was based on the label-free proteomics analysis (fold change of ±1.3; q < 0.05; n = 4) and immunoblotting (_t_-test; p < 0.05; n = 3). The lines between the proteins have the following color code: the red line indicates the presence of fusion evidence, the green line indicates neighborhood evidence, blue line indicates co-occurrence evidence, the purple line indicates experimental evidence, the yellow line indicates text mining evidence, the light blue indicates line database evidence, and the black line indicates co-expression evidence. The abbreviations and full names of the network proteins are as follows: AZI2: 5-azacytidine-induced protein 2; cGAS: cyclic GMP–AMP synthase; DDX58: antiviral innate immune response receptor RIG-I; ICAM1: intercellular adhesion molecule 1; IFI44: interferon-induced protein 44; IFI44L: interferon-induced protein 44-like; IFIT5: interferon-induced protein with tetratricopeptide repeats 5; IFITM3: interferon-induced transmembrane protein 3; ISG15: ubiquitin-like protein ISG15; ITGAL: integrin alpha-L; MAVS: mitochondrial antiviral-signaling protein; MX1: interferon-induced GTP-binding protein Mx1; MX2: interferon-induced GTP-binding protein Mx2; OAS2: 2′-5′-oligoadenylate synthase 2; OAS3: 2′-5′-oligoadenylate synthase 3; ORAI1: calcium release-activated calcium channel protein 1; STAT1: signal transducer and activator of transcription 1-alpha/beta; STAT3: signal transducer and activator of transcription 3; STING: stimulator of interferon genes protein; STIM1: stromal interaction molecule 1; TBK1: serine/threonine-protein kinase TBK1; TRAF6: TNF receptor-associated factor 6; UBA7: ubiquitin-like modifier-activating enzyme 7; USP18: Ubl carboxyl-terminal hydrolase 18.
Similar articles
- Data independent acquisition mass spectrometry of irradiated mouse lung endothelial cells reveals a STAT-associated inflammatory response.
Philipp J, Sievert W, Azimzadeh O, von Toerne C, Metzger F, Posch A, Hladik D, Subedi P, Multhoff G, Atkinson MJ, Tapio S. Philipp J, et al. Int J Radiat Biol. 2020 May;96(5):642-650. doi: 10.1080/09553002.2020.1712492. Epub 2020 Jan 21. Int J Radiat Biol. 2020. PMID: 31914348 - Radiation-Induced Endothelial Inflammation Is Transferred via the Secretome to Recipient Cells in a STAT-Mediated Process.
Philipp J, Azimzadeh O, Subramanian V, Merl-Pham J, Lowe D, Hladik D, Erbeldinger N, Ktitareva S, Fournier C, Atkinson MJ, Raj K, Tapio S. Philipp J, et al. J Proteome Res. 2017 Oct 6;16(10):3903-3916. doi: 10.1021/acs.jproteome.7b00536. Epub 2017 Sep 14. J Proteome Res. 2017. PMID: 28849662 - Integrative proteomics and targeted transcriptomics analyses in cardiac endothelial cells unravel mechanisms of long-term radiation-induced vascular dysfunction.
Azimzadeh O, Sievert W, Sarioglu H, Merl-Pham J, Yentrapalli R, Bakshi MV, Janik D, Ueffing M, Atkinson MJ, Multhoff G, Tapio S. Azimzadeh O, et al. J Proteome Res. 2015 Feb 6;14(2):1203-19. doi: 10.1021/pr501141b. Epub 2015 Jan 29. J Proteome Res. 2015. PMID: 25590149 - The cGAS-cGAMP-STING pathway connects DNA damage to inflammation, senescence, and cancer.
Li T, Chen ZJ. Li T, et al. J Exp Med. 2018 May 7;215(5):1287-1299. doi: 10.1084/jem.20180139. Epub 2018 Apr 5. J Exp Med. 2018. PMID: 29622565 Free PMC article. Review. - Role of the cGAS-STING pathway in cancer development and oncotherapeutic approaches.
Khoo LT, Chen LY. Khoo LT, et al. EMBO Rep. 2018 Dec;19(12):e46935. doi: 10.15252/embr.201846935. Epub 2018 Nov 16. EMBO Rep. 2018. PMID: 30446584 Free PMC article. Review.
Cited by
- Role and Mechanism of cGAS-STING Pathway in Cardiovascular System.
Yu X, Pan S. Yu X, et al. Rev Cardiovasc Med. 2024 Apr 7;25(4):135. doi: 10.31083/j.rcm2504135. eCollection 2024 Apr. Rev Cardiovasc Med. 2024. PMID: 39076568 Free PMC article. Review. - Preparation of a miR-155-activating nucleic acid nanoflower to study the molecular mechanism of miR-155 in inflammation.
Wang W, Geng J, Wu X, Zhang J, Zheng C, Rao H, Li T, Diao Y, Yang H. Wang W, et al. Mol Med. 2022 Jun 17;28(1):66. doi: 10.1186/s10020-022-00495-4. Mol Med. 2022. PMID: 35715753 Free PMC article. - Ferroptosis mechanisms and regulations in cardiovascular diseases in the past, present, and future.
Fang W, Xie S, Deng W. Fang W, et al. Cell Biol Toxicol. 2024 Mar 21;40(1):17. doi: 10.1007/s10565-024-09853-w. Cell Biol Toxicol. 2024. PMID: 38509409 Free PMC article. Review. - Cytosolic DNA sensing by cGAS: regulation, function, and human diseases.
Yu L, Liu P. Yu L, et al. Signal Transduct Target Ther. 2021 Apr 30;6(1):170. doi: 10.1038/s41392-021-00554-y. Signal Transduct Target Ther. 2021. PMID: 33927185 Free PMC article. Review. - An emerging double‑edged sword role of ferroptosis in cardiovascular disease (Review).
Qin S, Zhu C, Chen C, Sheng Z, Cao Y. Qin S, et al. Int J Mol Med. 2025 Jan;55(1):16. doi: 10.3892/ijmm.2024.5457. Epub 2024 Nov 14. Int J Mol Med. 2025. PMID: 39540363 Free PMC article. Review.
References
LinkOut - more resources
Full Text Sources
Molecular Biology Databases
Research Materials
Miscellaneous


