Depletion of gut microbiota induces skeletal muscle atrophy by FXR-FGF15/19 signalling - PubMed (original) (raw)
Depletion of gut microbiota induces skeletal muscle atrophy by FXR-FGF15/19 signalling
Yixuan Qiu et al. Ann Med. 2021 Dec.
Abstract
Background: Recent evidence indicates that host-gut microbiota crosstalk has nonnegligible effects on host skeletal muscle, yet gut microbiota-regulating mechanisms remain obscure.Methods: C57BL/6 mice were treated with a cocktail of antibiotics (Abx) to depress gut microbiota for 4 weeks. The profiles of gut microbiota and microbial bile acids were measured by 16S rRNA sequencing and ultra-performance liquid chromatography (UPLC), respectively. We performed qPCR, western blot and ELISA assays in different tissue samples to evaluate FXR-FGF15/19 signaling.Results: Abx treatment induced skeletal muscle atrophy in mice. These effects were associated with microbial dysbiosis and aberrant bile acid (BA) metabolism in intestine. Ileal farnesoid X receptor (FXR)-fibroblast growth factor 15 (FGF15) signaling was inhibited in response to microbial BA disturbance. Mechanistically, circulating FGF15 was decreased, which downregulated skeletal muscle protein synthesis through the extracellular-signal-regulated protein kinase 1/2 (ERK1/2) signaling pathway. Treating Abx mice with FGF19 (human FGF15 ortholog) partly reversed skeletal muscle loss.Conclusions: These findings indicate that the BA-FXR-FGF15/19 axis acts as a regulator of gut microbiota to mediate host skeletal muscle.
Keywords: FGF15/19; FXR; Gut microbiota; bile acid; skeletal muscle.
Conflict of interest statement
No potential conflict of interest was reported by the author(s).
Figures
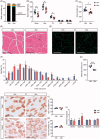
Figure 1.
Effects of gut microbiota depletion on skeletal muscle phenotype. (A) Body composition of vehicle (Veh) mice and antibiotic-treated (Abx) mice. N = 7 per group. (B) Hind limb muscle weight of quadriceps (Quad), gastrocnemius (Gas), tibialis anterior (TA), extensor digitorum longus (EDL) and soleus muscles. N = 7 per group. (C) Grip strength. N = 7 per group. (D) H&E staining of gastrocnemius cross-sections. Scale bar = 100 µm. (E) Representative images of laminin-stained gastrocnemius muscle. Scale bar = 100 µm. (F) Cell size profiling of gastrocnemius fibre cross-sectional area (CSA). N = 4 per group. (G) Mean fibre area of (F). (H,I) Representative histology staining against slow skeletal myosin heavy chain (Type I) and fast myosin skeletal heavy chain (Type II) of soleus muscle. Scale bar = 100 µm. (J,K) Distribution of Type I and Type II myofibers in soleus muscle. N = 3 per group. (L) Expression of myosin heavy chain genes in soleus muscle measured by qRT-PCR. N = 7 per group. Data are presented as mean ± SEM. *p < .05, **p < .01, ***p < .001, Veh vs Abx. Student’s _t_-test.
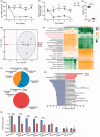
Figure 2.
Antibiotic treatment decreased bacteria abundance and changed microbiota composition related to bile acid metabolism. (A) DNA content extracted from faeces of Veh and Abx mice. (B) Change of bacterial load in faeces from baseline, evaluated by qPCR using universal bacterial 16S rRNA primers. (C) Faecal bacterial alpha diversity using Shannon index. (D) Principal component analysis (PCA) plot based on OTU composition. Each dot represented an individual mouse. (E) Functional prediction of gut microbiota on microbial metabolism pathway using PICRUSt2 tool. (F) Gut microbiota composition of Veh and Abx mice at phylum level. (G) Gut microbiota composition at family level by Linear discriminant analysis effect size (LEfSe) analysis. (H) Top of BSHs containing bacteria stains at genus level. N = 7 per group. For (A, B and H), data are presented as mean ± SEM. For (C), the box plots indicate the median, 25th to 75th percentiles (boxes), and minimum to maximum values (whiskers). *p < .05, **p < .01, ***p < .001, Veh vs Abx. Student’s _t_-test or Mann–Whitney _U_-test.
Figure 3.
Depletion of gut microbiota inhibited microbial bile acid metabolism and induced TβMCA accumulation. Total BA content in caecum content (A) and ileum (B) of Veh and Abx mice. Stacked bar plot of BA composition in caecum content (C) and ileum (D). The ratio of conjugated/unconjugated BA in caecum content (E) and ileum (F). The ratio of primary/secondary BA in caecum content (G) and ileum (H). (I) PCA plot of BA in caecum content and ileum. Each dot represented an individual BA sample. Concentration of TβMCA in caecum content (J) and ileum (K). Percentage of TβMCA in caecum content (L) and ileum (M). The ratio of TβMCA/TCA in caecum content (N) and ileum (O). N = 7 per group. Data are presented as mean ± SEM. *p < .05, **p < .01, Veh vs Abx. Mann–Whitney _U_-test.
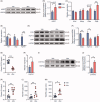
Figure 4.
Depletion of gut microbiota inhibited FXR-FGF15 signalling in ileum. (A) The expression of ASBT in ileum were detected by western blot. HSP90 served as a loading control. (B) The statistical analyses result of the western blot of (A). (C) The relative mRNA levels of BA transporter genes in ileum from Veh and Abx mice. (D) The relative mRNA levels of Fxr and Fxr targeting genes in ileum. (E) The expression of FXR, FGF15 and SHP in ileum were detected by western blot. (F) The statistical analyses result of the western blot of (E). (G) Plasma FGF15 levels. (H) The relative mRNA levels of BA synthesis enzyme genes Cyp7a1 in liver. (I) The expression of CYP7A1 in liver were detected by western blot. (J) The statistical analyses result of the western blot of (I). (K) Plasma 7-hydroxy-4-cholesten-3-one (C4) levels. (L,M) Total BA content in liver (L) and colon (M) of Veh and Abx mice. For (C,D, G,H and K–M), N = 7 per group. For (A,B, E,F and I,J), N = 3 per group. Data are presented as mean ± SEM. *p < .05, **p < .01, ***p < .001, Veh vs Abx. Student’s _t_-test.
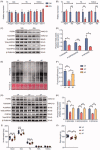
Figure 5.
Microbiota-induced FGF15/19 regulated muscle protein synthesis via ERK signalling. (A) The relative mRNA levels of Atrogin-1 and Murf-1 in Hind limb muscles of Veh mice and Abx mice. (B) The relative mRNA levels of FGF15/19 receptor genes in Hind limb muscles. (C) The expression of phosphorylated proteins and their total proteins related to ERK signalling in gastrocnemius muscle. β-TUBULIN served as a loading control. (D) The statistical analyses result of the intensity of phosphorylated proteins relative to corresponding total proteins of (C). (E) Puromycin levels were detected by western blot to represent protein synthesis rate in gastrocnemius muscle of VP mice, AP mice and AF mice. Ponceaus S staining served as a loading control. (F) The statistical analyses result of the intensity of puromycin. Puromycin was normalised to Ponceaus S staining. (G) The expression of phosphorylated proteins and their total proteins in gastrocnemius muscle. (H) The statistical analyses result of the intensity of phosphorylated proteins relative to corresponding total proteins of (G). Hind limb muscle weight (I) and grip strength (J) of three groups mice. For (A,B), N = 7 per group. For (C–H), N = 3 per group. For (I,J), N = 6 per group. Data are presented as mean ± SEM. *p < .05, **p < .01, ***p < .001. Student’s _t_-test or one-way ANOVA.
Figure 6.
A proposed molecular mechanism of crosstalk between gut microbiota and host skeletal muscle via FXR-FGF15/19 signalling in mice.
Similar articles
- Inhibition of Farnesoid-x-receptor signaling during abdominal sepsis by dysbiosis exacerbates gut barrier dysfunction.
Qian S, Su Z, Lin J, Hou Q, Wang X, Li Y, Wang J, Huang C, Wang Z, Cubero FJ, Wang X, Liao L. Qian S, et al. Cell Commun Signal. 2025 May 21;23(1):236. doi: 10.1186/s12964-025-02224-w. Cell Commun Signal. 2025. PMID: 40399878 Free PMC article. - Lactococcus petauri LZys1 modulates gut microbiota, diminishes ileal FXR-FGF15 signaling, and regulates hepatic function.
Li O, Zhou Y, Kim D, Xu H, Bao Z, Yang F. Li O, et al. Microbiol Spectr. 2025 Jun 3;13(6):e0171624. doi: 10.1128/spectrum.01716-24. Epub 2025 Apr 17. Microbiol Spectr. 2025. PMID: 40243350 Free PMC article. - Ileal FXR-FGF15/19 signaling activation improves skeletal muscle loss in aged mice.
Qiu Y, Yu J, Ji X, Yu H, Xue M, Zhang F, Li Y, Bao Z. Qiu Y, et al. Mech Ageing Dev. 2022 Mar;202:111630. doi: 10.1016/j.mad.2022.111630. Epub 2022 Jan 10. Mech Ageing Dev. 2022. PMID: 35026209 - Bile Acids as Hormones: The FXR-FGF15/19 Pathway.
Kliewer SA, Mangelsdorf DJ. Kliewer SA, et al. Dig Dis. 2015;33(3):327-31. doi: 10.1159/000371670. Epub 2015 May 27. Dig Dis. 2015. PMID: 26045265 Free PMC article. Review. - Gut microbiota-bile acid-skeletal muscle axis.
Mancin L, Wu GD, Paoli A. Mancin L, et al. Trends Microbiol. 2023 Mar;31(3):254-269. doi: 10.1016/j.tim.2022.10.003. Epub 2022 Oct 29. Trends Microbiol. 2023. PMID: 36319506 Review.
Cited by
- The Role of Gut Microbiota in the Skeletal Muscle Development and Fat Deposition in Pigs.
Han Q, Huang X, Yan F, Yin J, Xiao Y. Han Q, et al. Antibiotics (Basel). 2022 Jun 11;11(6):793. doi: 10.3390/antibiotics11060793. Antibiotics (Basel). 2022. PMID: 35740199 Free PMC article. - Progress of linking gut microbiota and musculoskeletal health: casualty, mechanisms, and translational values.
Wang Y, Li Y, Bo L, Zhou E, Chen Y, Naranmandakh S, Xie W, Ru Q, Chen L, Zhu Z, Ding C, Wu Y. Wang Y, et al. Gut Microbes. 2023 Dec;15(2):2263207. doi: 10.1080/19490976.2023.2263207. Epub 2023 Oct 6. Gut Microbes. 2023. PMID: 37800576 Free PMC article. Review. - Potential role of gut-related factors in the pathology of cartilage in osteoarthritis.
Ning P, Lin S, Shi Y, Liu T. Ning P, et al. Front Nutr. 2025 Jan 8;11:1515806. doi: 10.3389/fnut.2024.1515806. eCollection 2024. Front Nutr. 2025. PMID: 39845920 Free PMC article. Review. - Microbial metabolite trimethylamine-N-oxide induces intestinal carcinogenesis through inhibiting farnesoid X receptor signaling.
Zhang W, Qin X, Zhang K, Ma J, Li M, Jin G, Liu X, Wang S, Wang B, Wu J, Liu T, Zhong W, Cao H. Zhang W, et al. Cell Oncol (Dordr). 2024 Aug;47(4):1183-1199. doi: 10.1007/s13402-024-00920-2. Epub 2024 Feb 5. Cell Oncol (Dordr). 2024. PMID: 38315283 - Multiomics analysis reveals that microbiota regulate fat and muscle synthesis in chickens.
Yin HC, Yao WQ, Zhang H, Liu S, Ma TY, Xia CY. Yin HC, et al. Poult Sci. 2024 Mar;103(3):103417. doi: 10.1016/j.psj.2023.103417. Epub 2023 Dec 30. Poult Sci. 2024. PMID: 38218114 Free PMC article.
References
- Morais LH, Schreiber HLt, Mazmanian SK.. The gut microbiota-brain axis in behaviour and brain disorders. Nat Rev Microbiol. 2021;19:241–255. - PubMed
- Cryan JF, O'Riordan KJ, Cowan CSM, et al. . The microbiota-gut-brain axis. Physiol Rev. 2019;99(4):1877–2013. - PubMed
Publication types
MeSH terms
Substances
LinkOut - more resources
Full Text Sources
Other Literature Sources
Miscellaneous


