Learning curves for drug response prediction in cancer cell lines - PubMed (original) (raw)
doi: 10.1186/s12859-021-04163-y.
Thomas Brettin 3 4, Yvonne A Evrard 5, Yitan Zhu 6 3, Hyunseung Yoo 6 3, Fangfang Xia 6 3, Songhao Jiang 7, Austin Clyde 6 7, Maulik Shukla 6 3, Michael Fonstein 8, James H Doroshow 9, Rick L Stevens 4 7
Affiliations
- PMID: 34001007
- PMCID: PMC8130157
- DOI: 10.1186/s12859-021-04163-y
Learning curves for drug response prediction in cancer cell lines
Alexander Partin et al. BMC Bioinformatics. 2021.
Abstract
Background: Motivated by the size and availability of cell line drug sensitivity data, researchers have been developing machine learning (ML) models for predicting drug response to advance cancer treatment. As drug sensitivity studies continue generating drug response data, a common question is whether the generalization performance of existing prediction models can be further improved with more training data.
Methods: We utilize empirical learning curves for evaluating and comparing the data scaling properties of two neural networks (NNs) and two gradient boosting decision tree (GBDT) models trained on four cell line drug screening datasets. The learning curves are accurately fitted to a power law model, providing a framework for assessing the data scaling behavior of these models.
Results: The curves demonstrate that no single model dominates in terms of prediction performance across all datasets and training sizes, thus suggesting that the actual shape of these curves depends on the unique pair of an ML model and a dataset. The multi-input NN (mNN), in which gene expressions of cancer cells and molecular drug descriptors are input into separate subnetworks, outperforms a single-input NN (sNN), where the cell and drug features are concatenated for the input layer. In contrast, a GBDT with hyperparameter tuning exhibits superior performance as compared with both NNs at the lower range of training set sizes for two of the tested datasets, whereas the mNN consistently performs better at the higher range of training sizes. Moreover, the trajectory of the curves suggests that increasing the sample size is expected to further improve prediction scores of both NNs. These observations demonstrate the benefit of using learning curves to evaluate prediction models, providing a broader perspective on the overall data scaling characteristics.
Conclusions: A fitted power law learning curve provides a forward-looking metric for analyzing prediction performance and can serve as a co-design tool to guide experimental biologists and computational scientists in the design of future experiments in prospective research studies.
Keywords: Cell line; Deep learning; Drug response prediction; Learning curve; Machine learning; Power law.
Conflict of interest statement
The authors declare that they have no competing interests.
Figures
Fig. 1
Learning curve plotted on a linear scale in (a) and on a log scale in (b). The vertical axis is the generalization score in terms of the mean absolute error of model predictions. Each data point is the averaged prediction error, computed on a test set, of a gradient boosting decision tree (GBDT) that was trained on a subset of training samples of the GDSC1 dataset
Fig. 2
Histograms of dose-independent drug response (AUC) values of the four datasets listed in Table 1
Fig. 3
Two neural network architectures used in the analysis: a single-input network (sNN, 4.254 million trainable parameters) and b multi-input network (mNN, 4.250 million trainable parameters)
Fig. 4
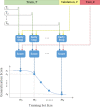
Workflow for generating learning curve data, LC, for a single split of a dataset. A single dataset split includes three sample sets: training T, validation V, and test E
Fig. 5
Learning curves generated by using dGBDT for multiple data splits of each of the datasets in Table 1. a The entire set of learning curve scores, LCraw, where each data point is the mean absolute error of predictions computed on test set E as a function of the training set size mk. A subset of scores in which the sample size is above mkmin (dashed black line) was considered for curve fitting. b Three curves were generated to represent the fit: q0.1 (blue curve) and q0.9 (green curve) representing the variability of the fit, and y~ (black curve) representing the learning curve fit
Fig. 6
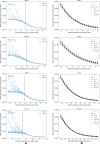
Comparison of learning curves of hGBDT, sNN, and mNN, for each of the four drug response datasets in Table 1. For each combination of a drug response dataset and an ML model, the data points and the corresponding curve are, respectively, the computed y~ values and the power law fit. The shaded area represents the variability of the fit which is bounded by the 0.1th quantile, q0.1, and 0.9th quantile, q0.9
Similar articles
- High frequency accuracy and loss data of random neural networks trained on image datasets.
Rorabaugh AK, Caíno-Lores S, Johnston T, Taufer M. Rorabaugh AK, et al. Data Brief. 2022 Jan 5;40:107780. doi: 10.1016/j.dib.2021.107780. eCollection 2022 Feb. Data Brief. 2022. PMID: 35036484 Free PMC article. - Sample Size Requirements for Popular Classification Algorithms in Tabular Clinical Data: Empirical Study.
Silvey S, Liu J. Silvey S, et al. J Med Internet Res. 2024 Dec 17;26:e60231. doi: 10.2196/60231. J Med Internet Res. 2024. PMID: 39689306 Free PMC article. - Boosting Tree-Assisted Multitask Deep Learning for Small Scientific Datasets.
Jiang J, Wang R, Wang M, Gao K, Nguyen DD, Wei GW. Jiang J, et al. J Chem Inf Model. 2020 Mar 23;60(3):1235-1244. doi: 10.1021/acs.jcim.9b01184. Epub 2020 Feb 3. J Chem Inf Model. 2020. PMID: 31977216 Free PMC article. - Data-driven modeling and prediction of blood glucose dynamics: Machine learning applications in type 1 diabetes.
Woldaregay AZ, Årsand E, Walderhaug S, Albers D, Mamykina L, Botsis T, Hartvigsen G. Woldaregay AZ, et al. Artif Intell Med. 2019 Jul;98:109-134. doi: 10.1016/j.artmed.2019.07.007. Epub 2019 Jul 26. Artif Intell Med. 2019. PMID: 31383477 Review. - Machine learning applications to clinical decision support in neurosurgery: an artificial intelligence augmented systematic review.
Buchlak QD, Esmaili N, Leveque JC, Farrokhi F, Bennett C, Piccardi M, Sethi RK. Buchlak QD, et al. Neurosurg Rev. 2020 Oct;43(5):1235-1253. doi: 10.1007/s10143-019-01163-8. Epub 2019 Aug 17. Neurosurg Rev. 2020. PMID: 31422572
Cited by
- Data augmentation and multimodal learning for predicting drug response in patient-derived xenografts from gene expressions and histology images.
Partin A, Brettin T, Zhu Y, Dolezal JM, Kochanny S, Pearson AT, Shukla M, Evrard YA, Doroshow JH, Stevens RL. Partin A, et al. Front Med (Lausanne). 2023 Mar 7;10:1058919. doi: 10.3389/fmed.2023.1058919. eCollection 2023. Front Med (Lausanne). 2023. PMID: 36960342 Free PMC article. - Deep learning methods for drug response prediction in cancer: Predominant and emerging trends.
Partin A, Brettin TS, Zhu Y, Narykov O, Clyde A, Overbeek J, Stevens RL. Partin A, et al. Front Med (Lausanne). 2023 Feb 15;10:1086097. doi: 10.3389/fmed.2023.1086097. eCollection 2023. Front Med (Lausanne). 2023. PMID: 36873878 Free PMC article. Review. - A cross-study analysis of drug response prediction in cancer cell lines.
Xia F, Allen J, Balaprakash P, Brettin T, Garcia-Cardona C, Clyde A, Cohn J, Doroshow J, Duan X, Dubinkina V, Evrard Y, Fan YJ, Gans J, He S, Lu P, Maslov S, Partin A, Shukla M, Stahlberg E, Wozniak JM, Yoo H, Zaki G, Zhu Y, Stevens R. Xia F, et al. Brief Bioinform. 2022 Jan 17;23(1):bbab356. doi: 10.1093/bib/bbab356. Brief Bioinform. 2022. PMID: 34524425 Free PMC article. - Converting tabular data into images for deep learning with convolutional neural networks.
Zhu Y, Brettin T, Xia F, Partin A, Shukla M, Yoo H, Evrard YA, Doroshow JH, Stevens RL. Zhu Y, et al. Sci Rep. 2021 May 31;11(1):11325. doi: 10.1038/s41598-021-90923-y. Sci Rep. 2021. PMID: 34059739 Free PMC article. - Improving model transferability for clinical note section classification models using continued pretraining.
Zhou W, Yetisgen M, Afshar M, Gao Y, Savova G, Miller TA. Zhou W, et al. J Am Med Inform Assoc. 2023 Dec 22;31(1):89-97. doi: 10.1093/jamia/ocad190. J Am Med Inform Assoc. 2023. PMID: 37725927 Free PMC article.
References
- Seashore-Ludlow B, et al. Harnessing connectivity in a large-scale small-molecule sensitivity dataset. Cancer Discov. 2015;5(11):1210–1223. doi: 10.1158/2159-8290.CD-15-0235. - DOI - PMC - PubMed
MeSH terms
Substances
LinkOut - more resources
Full Text Sources
Other Literature Sources
Medical
Research Materials


