MHC-II Signature Correlates With Anti-Tumor Immunity and Predicts anti-PD-L1 Response of Bladder Cancer - PubMed (original) (raw)
doi: 10.3389/fcell.2022.757137. eCollection 2022.
Shuo Hong 1, Yueming Zhang 1, Anqi Lin 1, Haoxuan Ying 1, Weidong Zou 1, Qiongyao Wang 1, Ting Wei 1, Quan Cheng 2, Weiliang Zhu 1, Peng Luo 1, Jian Zhang 1
Affiliations
- PMID: 35223828
- PMCID: PMC8873787
- DOI: 10.3389/fcell.2022.757137
MHC-II Signature Correlates With Anti-Tumor Immunity and Predicts anti-PD-L1 Response of Bladder Cancer
Ruibin Yi et al. Front Cell Dev Biol. 2022.
Abstract
A large proportion of anti-tumor immunity research is focused on major histocompatibility complex class I (MHC-I) molecules and CD8+ T cells. Despite mounting evidence has shown that CD4+ T cells play a major role in anti-tumor immunity, the role of the MHC-II molecules in tumor immunotherapy has not been thoroughly researched and reported. In this study, we defined a MHC-II signature for the first time by calculating the enrichment score of MHC-II protein binding pathway with a single sample gene set enrichment analysis (ssGSEA) algorithm. To evaluate and validate the predictive value of the MHC class II (MHC-II) signature, we collected the transcriptome, mutation data and matched clinical data of bladder cancer patients from IMvigor210, The Cancer Genome Atlas (TCGA) databases and Gene Expression Omnibus (GEO) databases. Comprehensive analyses of immunome, transcriptome, metabolome, genome and drugome were performed in order to determine the association of MHC-II signature and tumor immunotherapy. We identified that MHC-II signature is an independent and favorable predictor of immune response and the prognosis of bladder cancer treated with immune checkpoint inhibitors (ICIs), one that may be superior to tumor mutation burden. MHC-II signature was significantly associated with increased immune cell infiltration and levels of immune-related gene expression signatures. Additionally, transcriptomic analysis showed immune activation in the high-MHC-II signature subgroup, whereas it showed fatty acid metabolism and glucuronidation in the low-MHC-II signature subgroup. Moreover, exploration of corresponding genomic profiles highlighted the significance of tumor protein p53 (TP53) and fibroblast growth factor receptor 3 (FGFR3) alterations. Our results also allowed for the identification of candidate compounds for combined immunotherapy treatment that may be beneficial for patients with bladder cancer and a high MHC-II signature. In conclusion, this study provides a new perspective on MHC-II signature, as an independent and favorable predictor of immune response and prognosis of bladder cancer treated with ICIs.
Keywords: MHC-II signature; bladder cancer; immune checkpoint inhibitor; immune response; prognosis.
Copyright © 2022 Yi, Hong, Zhang, Lin, Ying, Zou, Wang, Wei, Cheng, Zhu, Luo and Zhang.
Conflict of interest statement
The authors declare that the research was conducted in the absence of any commercial or financial relationships that could be construed as a potential conflict of interest.
Figures
FIGURE 1
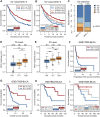
Cox proportional hazards regression analysis results for the ICI-cohort and flowchart. (A). Flowchart. We quantified MHC-II signature by using the ssGSEA method to calculate the MHC-II signature score, then divided the patients into MHC-H and MHC-L groups within the ICI-cohort (n = 348) and the TCGA-BLCA cohort (n = 350). Based on these categories, patients with different MHC-II signature levels were comprehensively analyzed and classified by their immunome, transcriptome, metabolome, genome and drugome data. We also collected the transcription and survival data of two GEO cohorts treated with immunotherapy to verify the predictive value of the MHC-II signature. MHC-H: MHC-II signature score high; MHC-L: MHC-II signature score low. (B) The forest plot displays the results of a univariate analysis. Variables with a Cox P value less than 0.05 are MHC-II, TMB, TNB and IC Level. MHC-II: MHC-II signature score. The signature scores of the gene sets were calculated using the ssGSEA algorithm. (C) The forest plot displays the results of a multivariate analysis. Only MHC-II signature was an independent and favorable predictor of bladder cancer patients treated with ICIs (P < 0.05). **(D)** The volcano plot displays the results of a univariate analysis between MHC-II signature score (blue) and 50 hallmark pathways scores (orange and gray). Gray dots indicate pathways with a Cox P value less than 0.05. The hazard ratio [HR] indicates protective (HR < 1) or risk (HR > 1) factors. The horizontal dashed line indicates p = 0.05. The gene sets of 50 hallmark pathways were obtained from the MSigDB. Orange dots from left to right indicate the following pathways: spermatogenesis, angiogenesis, coagulation, UV response DN, xenobiotic metabolism, TGFβ signaling, hypoxia, wntβ catenin signaling, reactive oxygen species pathway and p53 pathway.
FIGURE 2
High MHC-II signature predicts the favorable prognosis and immune response of ICIs. (A) The KM analysis was performed on MHC-H (n = 138) and MHC-L (n = 210) groups in the ICI-cohort. The overall survival (OS) of the MHC-H group was significantly longer than that of MHC-L group (hazard ratio [HR] = 0.63, 95% confidence interval [CI]: 0.49–0.82, log rank test P = 7.60e-04). (B) MHC-II signature quartiles were also significantly associated with OS. (C) MHC-II signature was highly correlated with immune response, particularly with complete response (CR) (two sided Fisher’s exact test, P < 0.01; n = 298; The response status of 50 cases was not reported). PD, progressive disease; SD, stable disease; PR, partial response. (D,E) MHC-II signature was highly correlated with the expression of PD-L1, including TC levels (D) and IC levels (E) (all P < 0.001). Tumor tissue samples were scored via immunohistochemistry (IHC) for PDL1 expression on tumor cells (TC) and tumor-infiltrating immune cells (IC), respectively. Specimens were scored as IHC TC0, TC1, TC2, or TC3 if <1%, ≥1% but <5%, ≥5% but <50%, or ≥50% of TC were PD-L1 positive, respectively. Specimens were scored as IHC IC0, IC1, IC2, or IC3 if <1%, ≥1% but <5%, ≥5% but <10%, or ≥10% of IC were PD-L1 positive, respectively. Tumor-infiltrating immune cells included macrophages, dendritic cells and lymphocytes. *P < 0.05, **P < 0.01, ***P < 0.001, and ****P < 0.0001, ns, not significant. (F) Validation of the GSE17630−BLCA cohort (n = 87) treated with ICIs showed that the PFS of the MHC-H group was significantly longer than that of the MHC-L group (HR = 0.50, 95% CI: 0.28–0.89, log rank test P = 0.046). (G). Validation of the GSE17630−BLCA cohort (n = 87) treated with ICIs showed that the OS of the MHC-H group was significantly longer than that of the MHC-L group (HR = 0.43, 95% CI: 0.24–0.76, log rank test P = 0.015). (H) Validation of the GSE19423-BLCA cohort (n = 48) treated with ICIs showed that the OS of the MHC-H group was significantly longer than that of the MHC-L group (HR = 0.32, 95% CI: 0.11–0.94, log rank test P = 0.015). (I) Validation of the GSE19423-BLCA cohort treated with ICIs showed that MHC-II signature quartiles were also significantly correlated with OS.
FIGURE 3
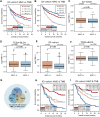
MHC-II signature is superior to TMB and slightly inferior to TNB as predictive biomarkers. (A) KM analysis showed that MHC-II signature was superior to TMB in the ICI-cohort (MHC-II signature: HR = 0.47, 95% CI: 0.34–0.65, P = 2.60e-05; TMB: HR = 0.49, 95% CI: 0.34–0.70, P = 1.38e-05). (B) KM analysis showed that MHC-II signature was slightly inferior to TNB in the ICI-cohort (MHC-II signature: HR = 0.47, 95% CI: 0.34–0.65, P = 2.60e-05; TNB: HR = 0.35, 95% CI: 0.25–0.49, P = 1.02e-06). (C,D) Boxplots show that there was no significant relationship between MHC-II signature and TMB in either the ICI-cohort (C) or the TCGA-BLCA cohort (D) (Wilcoxon Test, all P > 0.05). E-F. Boxplots showed that there was no significant relationship between MHC-II signature and TNB in either the ICI-cohort (E) or the TCGA-BLCA cohort (F) (wilcoxon test, all P > 0.05). (G) Venn diagram showed the distribution in the MHC-H and MHC-L groups of patients with known TMB and TNB status in the ICI-cohort (n = 218). (H) KM curves show the comparison of MHC-H + TMB-H, MHC-H + TMB-L, MHC-L + TMB-H and MHC-L + TMB-L in ICI-cohort (n = 218). (I) KM curves show the comparison of MHC-H + TNB-H, MHC-H + TNB-L, MHC-L + TNB-H and MHC-L + TNB-L in the ICI-cohort (n = 218).
FIGURE 4
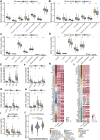
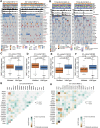
MHC-II signature shows correlation with immune cell infiltration and anti-tumor immunity. (A,B) MCP-counter analyses quantifying immune cells and stromal cells in MHC-H and MHC-L groups in ICI-cohort (A) and TCGA-BLCA cohort (B) (C,D) EPIC analyses quantifying the infiltration ratio of immune cells of the MHC-H and MHC-L groups in the ICI-cohort (C) and TCGA-BLCA cohort (D) (E–I) xCell analyses estimate the abundance scores of 64 kinds of immune cells in the MHC-H and MHC-L groups in the ICI-cohort. Dendritic cells (E) include conventional dendritic cells (cDCs), plasmacytoid dendritic cells (pDCs) and immature dendritic cells (iDCs); CD4+T cells (F) include CD4+memory T cells, CD4+naive T cells, CD4+ central memory T cells and CD4+ effector memory T cells; CD8+T cells (G) include CD8+ naive T cells, CD8+ T central memory T cells and CD8+ T effector memory T cells; other types of T cells (H) include T cell gamma delta cells (Tgd), T helper 2 cells (Th2) and regulatory cells (Tregs). Macrophages (I) include M1 macrophages and M2 macrophages. (J) Violin plot showed the distribution of tumor immunophenotype in the MHC-H and MHC-L groups of the ICI-cohort. (K) Heatmap showing the significant difference in the average expression of immune cell-related genes (logFC ≥ 1.5 and P < 0.01) between the MHC-H and MHC-L groups of the ICI-cohort and TCGA-BLCA cohort. Genes which correspond to the same cell type are indicated by the same color. From left to right are the name of the gene, the cell type corresponding to the gene, and the direction of change in gene expression. Red in the right rectangle indicates up-regulation, and blue indicates down-regulation. The logFC value was marked in the right rectangle. **(L)** Heatmap showing the significant difference in the average expression of immune-related genes between the MHC-H and MHC-L groups in the ICI-cohort and the TCGA-BLCA cohort. Genes of the same category were indicated by the same color. From left to right are the name of the gene, gene function, and the direction of change in gene expression. Red in the right rectangle indicates up-regulation, blue indicates down-regulation, and white indicates that the result was not significant (P > 0.05). The logFC value was marked in the right rectangle. (A−J) *P < 0.05, **P < 0.01, ***P < 0.001, and ****P < 0.0001, ns, not significant.
FIGURE 5
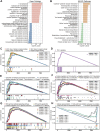
Transcriptome traits related to MHC-II signature in the ICI-cohort. (A,B). Gene Ontology enrichment (A) and KEGG enrichment analyses (B) show that gene sets up-regulated in MHC-H tumors were enriched in the immune activation process, while those overexpressed in MHC-L tumors were enriched in fatty acid metabolism and steroid hormone biosynthesis. The top ten genes per set are shown (ranked by single-gene p value, GO: red: high, blue: low; KEGG: orange: high, green: low). (C–H) The GSEA analysis shows the key pathways of enrichment in the MHC-H (up) and MHC-L (down) groups. Antigen processing and presentation (C), PD−1 signaling (D), immune cell activation (E), cytokine production (F), and IFN−gamma (G) related pathways were significantly up-regulated in the MHC-H group, while fatty acid metabolism and glucuronidation (H) were significantly up-regulated in the MHC-L group. The _x_-axis represents the ranking of genes in the rank lists.
FIGURE 6
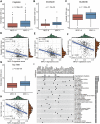
Genomic landscape related to MHC-II signature. (A) Comparison of the differences in the mutation status in the top 20 genes with mutations, diagnosis years (age), sex, TCGA stage, PD-L1 expression (IC level and TC level), immune response, OS, TMB and TNB between MHC-H (left) and MHC-L groups (right) in the ICI-cohort. Genes were ranked by mutation frequency (left panel). The mutation frequencies of TP53, RB1, FGFR3, and MDM2 genes were significantly different between two groups, which are marked with red font. *P < 0.05, **P < 0.01, ***P < 0.001, and ****P < 0.0001. (B) Comparison of the differences in the mutation status in the top 20 genes with mutations, age, sex, TCGA stage, BMI, smoking status, race, OS, TMB and TNB between the MHC-H (left) and MHC-L groups (right) in TCGA-BLCA cohort. Genes were ranked by mutation frequency (left panel). The mutation frequencies of TP53, RB1, and FGFR3 genes were significantly different between two groups, which are marked with red font. *P < 0.05, **P < 0.01, ***P < 0.001, and ****P < 0.0001. C-F. Boxplots show that TP53 (C) and RB1 (D) gene mutations were significantly correlated with high MHC-II signature in the ICI-cohort (Mann Whitney U test, P = 0.0014, P = 0.005, respectively), while FGFR3 (E) and MDM2 (F) gene mutations are significantly correlated with low MHC-II signature in the ICI-cohort (Mann Whitney U test, P = 2.2e-09, P = 0.0047, respectively). G-H. Concurrence (blue) and mutual exclusion (brown) between high frequency mutation genes (the top 20 genes with mutations) in MHC-H (G) and MHC-L (H) groups in the ICI-cohort. ∙P < 0.05, *P < 0.01.
FIGURE 7
Role of MHC-II signature in drug sensitivity prediction in the ICI-cohort. (A–H) Boxplots show that the IC50 values of Cisplatin (A), Docetaxel (B), Sunitinib (C) and NU.7441 (G) were significantly lower in the MHC-H group compared to the MHC-L group (Wilcoxon.test, P = 2.99e−06, P = 1.15e−08, P = 1.32e−5, P = 6.42e−08, respectively). And IC50 values of Cisplatin (D), Docetaxel (E), Sunitinib (F) and NU.7441 (H) were negatively correlated with MHC-II signature score (Pearson test, rPearson = −0.24, rPearson = −0.36, rPearson = −0.32, rPearson = −0.41, respectively. All P < 0.001. (I) Heatmap shows the MoA (row) shared by each compound (column, n = 35) in the ICI-cohort. The MoA is sorted according to the number of compounds sharing the MoA, displayed in the heatmap.
FIGURE 8
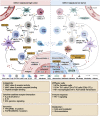
A proposed mechanism underlying the improved efficacy and prognosis in bladder cancer patients with high MHC-II signature after immunotherapy. This picture was created with BioRender.com (
https://app.biorender.com/biorender-templates
).
Similar articles
- Comprehensive FGFR3 alteration-related transcriptomic characterization is involved in immune infiltration and correlated with prognosis and immunotherapy response of bladder cancer.
Xu T, Xu W, Zheng Y, Li X, Cai H, Xu Z, Zou Q, Yu B. Xu T, et al. Front Immunol. 2022 Jul 26;13:931906. doi: 10.3389/fimmu.2022.931906. eCollection 2022. Front Immunol. 2022. PMID: 35958598 Free PMC article. - A radiomics approach to assess tumour-infiltrating CD8 cells and response to anti-PD-1 or anti-PD-L1 immunotherapy: an imaging biomarker, retrospective multicohort study.
Sun R, Limkin EJ, Vakalopoulou M, Dercle L, Champiat S, Han SR, Verlingue L, Brandao D, Lancia A, Ammari S, Hollebecque A, Scoazec JY, Marabelle A, Massard C, Soria JC, Robert C, Paragios N, Deutsch E, Ferté C. Sun R, et al. Lancet Oncol. 2018 Sep;19(9):1180-1191. doi: 10.1016/S1470-2045(18)30413-3. Epub 2018 Aug 14. Lancet Oncol. 2018. PMID: 30120041 - RB1 and TP53 co-mutations correlate strongly with genomic biomarkers of response to immunity checkpoint inhibitors in urothelial bladder cancer.
Manzano RG, Catalan-Latorre A, Brugarolas A. Manzano RG, et al. BMC Cancer. 2021 Apr 20;21(1):432. doi: 10.1186/s12885-021-08078-y. BMC Cancer. 2021. PMID: 33879103 Free PMC article. - Mechanisms of low MHC I expression and strategies for targeting MHC I with small molecules in cancer immunotherapy.
Kong S, Zhang J, Wang L, Li W, Guo H, Weng Q, He Q, Lou H, Ding L, Yang B. Kong S, et al. Cancer Lett. 2024 Dec 25;611:217432. doi: 10.1016/j.canlet.2024.217432. Online ahead of print. Cancer Lett. 2024. PMID: 39730087 Review. - Membrane protein trafficking in the anti-tumor immune response: work of endosomal-lysosomal system.
Jin Y, Deng Z, Zhu T. Jin Y, et al. Cancer Cell Int. 2022 Dec 17;22(1):413. doi: 10.1186/s12935-022-02805-6. Cancer Cell Int. 2022. PMID: 36528587 Free PMC article. Review.
Cited by
- Molecular determinants of response to neoadjuvant pembrolizumab plus chemotherapy in patients with high-risk, early-stage, triple-negative breast cancer: exploratory analysis of the open-label, multicohort phase 1b KEYNOTE-173 study.
Dent R, Cortés J, Park YH, Muñoz-Couselo E, Kim SB, Sohn J, Im SA, Holgado E, Foukakis T, Kümmel S, Yearley J, Wang A, Nebozhyn M, Huang L, Cristescu R, Jelinic P, Karantza V, Schmid P. Dent R, et al. Breast Cancer Res. 2025 Mar 11;27(1):35. doi: 10.1186/s13058-024-01946-y. Breast Cancer Res. 2025. PMID: 40069763 Free PMC article. Clinical Trial. - Molecular biomarkers of progression in non-muscle-invasive bladder cancer - beyond conventional risk stratification.
Olislagers M, de Jong FC, Rutten VC, Boormans JL, Mahmoudi T, Zuiverloon TCM. Olislagers M, et al. Nat Rev Urol. 2025 Feb;22(2):75-91. doi: 10.1038/s41585-024-00914-7. Epub 2024 Aug 2. Nat Rev Urol. 2025. PMID: 39095581 Review. - Killer instincts: natural killer cells as multifactorial cancer immunotherapy.
Nersesian S, Carter EB, Lee SN, Westhaver LP, Boudreau JE. Nersesian S, et al. Front Immunol. 2023 Nov 28;14:1269614. doi: 10.3389/fimmu.2023.1269614. eCollection 2023. Front Immunol. 2023. PMID: 38090565 Free PMC article. Review. - Role of CD4+ T cells in cancer immunity: a single-cell sequencing exploration of tumor microenvironment.
An Q, Duan L, Wang Y, Wang F, Liu X, Liu C, Hu Q. An Q, et al. J Transl Med. 2025 Feb 14;23(1):179. doi: 10.1186/s12967-025-06167-1. J Transl Med. 2025. PMID: 39953548 Free PMC article. Review. - Natural biomolecules and derivatives as anticancer immunomodulatory agents.
Bernitsa S, Dayan R, Stephanou A, Tzvetanova ID, Patrikios IS. Bernitsa S, et al. Front Immunol. 2023 Jan 9;13:1070367. doi: 10.3389/fimmu.2022.1070367. eCollection 2022. Front Immunol. 2023. PMID: 36700235 Free PMC article. Review.
References
- Antonelli A. C., Binyamin A., Hohl T. M., Glickman M. S., Redelman-Sidi G. (2020). Bacterial Immunotherapy for Cancer Induces CD4-dependent Tumor-specific Immunity through Tumor-Intrinsic Interferon-γ Signaling. Proc. Natl. Acad. Sci. USA 117, 18627–18637. 10.1073/pnas.2004421117 - DOI - PMC - PubMed
LinkOut - more resources
Full Text Sources
Research Materials
Miscellaneous

