NLRP12-PANoptosome activates PANoptosis and pathology in response to heme and PAMPs - PubMed (original) (raw)
NLRP12-PANoptosome activates PANoptosis and pathology in response to heme and PAMPs
Balamurugan Sundaram et al. Cell. 2023.
Abstract
Cytosolic innate immune sensors are critical for host defense and form complexes, such as inflammasomes and PANoptosomes, that induce inflammatory cell death. The sensor NLRP12 is associated with infectious and inflammatory diseases, but its activating triggers and roles in cell death and inflammation remain unclear. Here, we discovered that NLRP12 drives inflammasome and PANoptosome activation, cell death, and inflammation in response to heme plus PAMPs or TNF. TLR2/4-mediated signaling through IRF1 induced Nlrp12 expression, which led to inflammasome formation to induce maturation of IL-1β and IL-18. The inflammasome also served as an integral component of a larger NLRP12-PANoptosome that drove inflammatory cell death through caspase-8/RIPK3. Deletion of Nlrp12 protected mice from acute kidney injury and lethality in a hemolytic model. Overall, we identified NLRP12 as an essential cytosolic sensor for heme plus PAMPs-mediated PANoptosis, inflammation, and pathology, suggesting that NLRP12 and molecules in this pathway are potential drug targets for hemolytic and inflammatory diseases.
Keywords: DAMP; IRF1; NLRP12; PAMP; RIPK3; TLR2; TLR4; apoptosis; caspase; caspase-1; caspase-8; gasdermin; heme; hemolysis; inflammasome; inflammatory cell death; necroptosis; pyroptosis.
Copyright © 2023 The Author(s). Published by Elsevier Inc. All rights reserved.
Conflict of interest statement
Declaration of interests T.-D.K. previously served as a consultant for Pfizer. St. Jude Children’s Research Hospital filed a provisional patent application on methods for modulating NLRP12 described in this study, listing B.S. and T.-D.K. as inventors (serial no. 63/422,601 and 63/501,430).
Figures
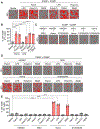
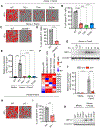
Figure 1.. Identification of unique PAMP and DAMP combinations that induce inflammatory cell death
(A and B) Representative images of cell death (A) and quantification showing percentage of cell death (B) in wildtype (WT) bone marrow-derived macrophages (BMDMs) in response to media or treatment with combinations of Pam3CSK4 (Pam3) plus lipopolysaccharide (LPS), polyinosinic:polycytidylic acid (poly(I:C)) or Resiquimod (R848); or LPS plus poly(I:C) or R848; or poly(I:C) plus R848 for 48 h. (C) Representative images of cell death in WT BMDMs treated with combinations of high-mobility group box 1 protein (HMGB1) plus monosodium urate (MSU), heme or S100A8/A9; or MSU plus heme or S100A8/A9; or heme plus S100A8/A9 for 48 h. (D and E) Representative images of cell death (D) and quantification showing percentage of cell death (E) in WT BMDMs treated with combinations of HMGB1 plus Pam3, LPS, poly(I:C) or R848; MSU plus Pam3, LPS, poly(I:C) or R848; heme plus Pam3, LPS, poly(I:C) or R848; or S100A8/A9 plus Pam3, LPS, poly(I:C) or R848 for 48 h. Scale bar = 50 μm (A, C, D). Data are representative of at least three independent experiments. Data are shown as mean ± SEM (B, E). Analysis was performed using the one-way ANOVA (B, E). ****P < 0.0001. See also Figures S1 and S2.
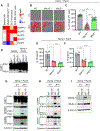
Figure 2.. NLRP12 regulates inflammatory cell death, PANoptosis, induced by heme plus PAMPs
(A) Heatmap depicting the expression profile of NLRPs in malaria whole blood (WB), malaria bone marrow (BM) CD71+ cells, sickle cell disease (SCD) monocytes and SCD BM CD34+ cells compared to healthy controls. (B and C) Representative images of cell death (B) and quantification showing percentage of cell death (C) in wildtype (WT), _Nlrp12_−/− and _Nlrp3_−/− bone marrow-derived macrophages (BMDMs) treated with heme plus Pam3CSK4 (Pam3) for 48 h. (D) Immunoblot showing pro- (P45) and activated (P20) caspase-1 (CASP1) in WT, _Nlrp12_−/−and _Nlrp3_−/− BMDMs at 0 h (media control) or treated with heme plus Pam3 for 42 h. (E–F) Measurement of IL-1β (E) and IL-18 (F) release from the supernatant of WT, _Nlrp12_−/− and _Nlrp3_−/− BMDMs treated with heme plus Pam3 for 36 h. (G–I) Immunoblot analysis of (G) pro- (P45) and activated (P20) CASP1, pro- (P53), activated (P30) and inactivated (P20) gasdermin D (GSDMD) and pro- (P53) and activated (P34) gasdermin E (GSDME); (H) pro- (P55) and cleaved caspase-8 (CASP8; P18), pro- (P35) and cleaved caspase-3 (CASP3; P19 and P17); pro- (P35) and cleaved caspase-7 (CASP7; P20), and (I) phosphorylated MLKL (pMLKL) and total MLKL (tMLKL) in WT and _Nlrp12_−/− BMDMs at 0 h or treated with heme plus Pam3 for 36 h. β-actin was used as a loading control. Scale bar = 50 μm (B). Data are representative of at least three independent experiments. Data are shown as mean ± SEM (C, E, F). Analysis was performed using the non-parametric Wilcox test (A) or the one-way ANOVA (C, E, F). *P < 0.05, **P < 0.01, ***P < 0.001, ****P < 0.0001. See also Figure S3.
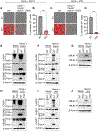
Figure 3.. NLRP12 drives caspase-1/caspase-8/RIPK3-dependent PANoptosis induced by heme plus PAMPs
(A–D) Representative images of cell death (A and C) and quantification showing percentage of cell death (B and D) in wildtype (WT) and _Casp1_−/−_Casp8_−/−_Ripk3_−/− (TKO) bone marrow-derived macrophages (BMDMs) stimulated with heme plus Pam3CSK4 (Pam3) (A and B) or heme plus lipopolysaccharide (LPS) (C and D) for 0 h and 48 h. Quantification is shown for the 48 h timepoint. (E–J) Immunoblot analysis of (E and H) pro- (P45) and activated (P20) caspase-1 (CASP1), pro- (P53), activated (P30) and inactivated (P20) gasdermin D (GSDMD) and pro- (P53) and activated (P34) gasdermin E (GSDME); (F and I) pro- (P55) and cleaved caspase-8 (CASP8; P18), pro- (P35) and cleaved caspase-3 (CASP3; P19 and P17) and pro- (P35) and cleaved caspase-7 (CASP7; P20); and (G and J) phosphorylated MLKL (pMLKL) and total MLKL (tMLKL) in WT and TKO BMDMs treated with heme plus Pam3 (E–G) or heme plus LPS (H–J) for 36 h. β-actin was used as a loading control. Scale bar = 50 μm (A and C). Data are representative of at least three independent experiments. Data are shown as mean ± SEM (B and D). Analysis was performed using the unpaired t test (B and D). ****P < 0.0001. Red asterisk denotes nonspecific band (F and I). See also Figure S4.
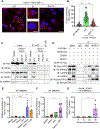
Figure 4.. NLRP12 expression and formation of the PANoptosome through interactions among cell death molecules drive inflammatory cell death
(A and B) Representative images of ASC specks (A) and quantification showing percentage of cell containing ASC specks (B) in wildtype (WT) and _Nlrp12_−/− bone marrow-derived macrophages (BMDMs) treated with heme plus Pam3CSK4 (Pam3) for 36 h. White arrows indicate ASC speck formation (A). Unstimulated WT BMDMs were used as a media control. (C) Immunoblot analysis of ASC, RIPK3, caspase-8 (CASP8) and NLRP3 following immunoprecipitation (IP) with anti-ASC or IgG control antibodies in WT, _Nlrp12_−/− and _Pycard_−/− BMDMs after 28 h of heme plus Pam3 treatment. (D) Immunoblot analysis of Myc-tagged ASC, HA-tagged RIPK3, CASP8, NLRP3, and Flag-tagged NLRP12 following IP with anti-ASC or anti-Flag (NLRP12) antibodies from lysates of 239T cells in an overexpression system. GAPDH was used as a loading control (C and D). (E) Measurement of the relative expression of Nlrp12 mRNA normalized to β-Actin expression in WT BMDMs treated with media, heme, Pam3, lipopolysaccharide (LPS), heme plus Pam3 or heme plus LPS for 36 h. (F) Measurement of the relative expression of Nlrp12 mRNA normalized to β-Actin expression in WT BMDMs treated with media, heme, TNF or heme plus TNF for 42 h. (G) Measurement of the relative expression of Nlrp12 mRNA normalized to β-Actin expression in WT BMDMs treated with heme plus Pam3 for 0, 12, 24 and 36 h. Scale bar = 10 μm (A), and 2× scale bar = 5 μm (A). Data are representative of at least three independent experiments. Data are shown as mean ± SEM (B and E–G). Analysis was performed using the one-way ANOVA (B and E–G). **P < 0.01, ****P < 0.0001. See also Figure S5.
Figure 5.. TLR2 and TLR4 regulate IRF1 expression to drive NLRP12-dependent PANoptosis
(A and B) Representative images of cell death (A) and quantification showing percentage of cell death (B) in wildtype (WT) and _Tlr2_−/−, _Tlr4_−/− and _Tlr2_−/−/_Tlr4_−/− (Tlr2/_4_−/−) bone marrow-derived macrophages (BMDMs) stimulated with heme plus Pam3CSK4 (Pam3) for 48 h. (C and D) Representative images of cell death (C) and quantification showing percentage of cell death (D) in WT and _Myd88_−/− BMDMs stimulated with heme plus Pam3 for 48 h. (E) Measurement of the relative expression of Nlrp12 mRNA normalized to β-Actin expression in WT and _Tlr2_−/−, _Tlr4_−/− and Tlr2/_4_−/− BMDMs stimulated with heme plus Pam3 for 36 h. (F) Heatmap depicting the expression profile of interferon regulatory factors (IRFs) in malaria whole blood (WB), malaria bone marrow (BM) CD71+ cells, sickle cell disease (SCD) monocytes and SCD BM CD34+ cells compared to healthy controls. (G) Immunoblot analysis of IRF1 in WT BMDMs treated with heme plus Pam3 for 0 h, 0.25 h, 0.5 h, 1 h, 3 h, 6 h, 9 h, 12 h and 24 h. β-actin was used as a loading control. (H and I) Representative images of cell death (H) and quantification showing percentage of cell death (I) in WT and _Irf1_−/− BMDMs stimulated with heme plus Pam3 for 48 h. (J) Measurement of the relative expression of Nlrp12 mRNA normalized to β-Actin expression in WT and _Irf1_−/− BMDMs treated with media or heme plus Pam3 for 36 h. (K) Immunoblot analysis of IRF1 in WT and _Tlr2_−/−, _Tlr4_−/− and Tlr2/_4_−/− BMDMs stimulated with heme plus Pam3 for 3 h or in media control. β-actin was used as a loading control. Scale bar = 50 μm (A, C and H). Data are representative of at least three independent experiments. Data are shown as mean ± SEM (B, D, E, I and J). Analysis was performed using the one-way ANOVA (B, E and J), the t test (D and I) or the non-parametric Wilcox test (F). *P < 0.05, **P < 0.01, ****P < 0.0001. See also Figure S6.
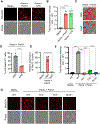
Figure 6.. ROS generation downstream of TLR signaling drives heme plus PAMP-mediated inflammatory cell death
(A and B) Representative images of MitoSOX red (Top) and phase contrast imaging (Bottom) (A) and quantification showing total fluorescence intensity (B) of panel (A) in wildtype (WT) bone marrow-derived macrophages (BMDMs) stimulated with heme plus Pam3CSK4 (Pam3) or heme plus lipopolysaccharide (LPS) for 36 h. (C and D) Representative images of cell death (C) and quantification showing percentage of cell death (D) in WT BMDMs stimulated with heme plus Pam3 with and without N-acetyl cysteine (NAC) treatment for 48 h. (E) Measurement of the relative expression of Nlrp12 mRNA normalized to β-Actin expression in WT BMDMs treated with media or heme plus Pam3 with and without NAC treatment for 48 h. (F and G) Representative images of MitoSOX red (Top) and phase contrast imaging (Bottom) (G) and quantification showing total fluorescence intensity (F) of panel (G) in WT and _Tlr2_−/−, _Tlr4_−/− and Tlr2/_4_−/− BMDMs stimulated with heme plus Pam3 for 36 h. Scale bar = 50 μm (A, C and G). Data are representative of at least three independent experiments. Data are shown as mean ± SEM (B, D–F). Analysis was performed using the t test (D) or the one-way ANOVA (B, E and F). ****P < 0.0001. See also Figure S6.
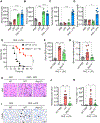
Figure 7.. NLRP12 drives acute kidney injury and cell death to induce lethality in hemolytic disease model
(A–D) Measurement of serum heme (A), iron (B), blood urea nitrogen (BUN) (C) and creatinine (D) in wildtype (WT) mice injected with PBS (n = 5), lipopolysaccharide (LPS) (n = 5), phenylhydrazine (PHZ) (n = 6) or PHZ and LPS (n = 6) at 26 h post-treatment. (E) Survival of 6- to 8-week-old male WT (n = 21) and _Nlrp12_−/− (n = 14) mice after intraperitoneal injection of PHZ and LPS. (F and G) Measurement of serum BUN (F) and creatinine (G) in WT and _Nlrp12_−/− mice injected with PBS or PHZ and LPS (WT PBS, n = 5; WT PHZ + LPS, n = 7–8; _Nlrp12_−/− PHZ + LPS, n = 7) at 30 h post-treatment. (H and J) Hematoxylin and eosin (H&E) staining (H) and quantification of histology score from panel H (J) in kidney tissues from WT and _Nlrp12_−/− mice injected with PBS or PHZ and LPS at 30 h post-treatment. Outlined area indicates luminal debris/hemoglobin casts (H). (I and K) TUNEL staining (I) and quantification of TUNEL positive cells from panel I (K) in kidney tissues from WT and _Nlrp12_−/− mice injected with PBS or PHZ and LPS at 30 h post-treatment. Arrows indicate TUNEL-positive cells (I). Scale bar = 20 μm (H and I). Data are representative of at least three independent experiments. Data are shown as mean ± SEM (A–D, F, G, J and K). Analysis was performed using the log-rank (Mantel-Cox) test (E) or the one-way ANOVA (A–D, F, G, J and K). *P < 0.05, **P < 0.01, ***P < 0.001, ****P < 0.0001. See also Figure S7.
Comment in
- NLRP12 drives PANoptosis in response to heme.
Henkel FDR, O'Neill LAJ. Henkel FDR, et al. Trends Immunol. 2023 Aug;44(8):574-576. doi: 10.1016/j.it.2023.06.008. Epub 2023 Jul 7. Trends Immunol. 2023. PMID: 37423881 - NLRP12 senses heme and PAMPs to drive necrotic cell death and inflammation.
Bernard EM, Broz P. Bernard EM, et al. Mol Cell. 2023 Aug 3;83(15):2621-2623. doi: 10.1016/j.molcel.2023.07.005. Mol Cell. 2023. PMID: 37541218
Similar articles
- Immune regulator IRF1 contributes to ZBP1-, AIM2-, RIPK1-, and NLRP12-PANoptosome activation and inflammatory cell death (PANoptosis).
Sharma BR, Karki R, Rajesh Y, Kanneganti TD. Sharma BR, et al. J Biol Chem. 2023 Sep;299(9):105141. doi: 10.1016/j.jbc.2023.105141. Epub 2023 Aug 7. J Biol Chem. 2023. PMID: 37557956 Free PMC article. - NLRC5 senses NAD+ depletion, forming a PANoptosome and driving PANoptosis and inflammation.
Sundaram B, Pandian N, Kim HJ, Abdelaal HM, Mall R, Indari O, Sarkar R, Tweedell RE, Alonzo EQ, Klein J, Pruett-Miller SM, Vogel P, Kanneganti TD. Sundaram B, et al. Cell. 2024 Jul 25;187(15):4061-4077.e17. doi: 10.1016/j.cell.2024.05.034. Epub 2024 Jun 14. Cell. 2024. PMID: 38878777 Free PMC article. - NLRP12 drives PANoptosis in response to heme.
Henkel FDR, O'Neill LAJ. Henkel FDR, et al. Trends Immunol. 2023 Aug;44(8):574-576. doi: 10.1016/j.it.2023.06.008. Epub 2023 Jul 7. Trends Immunol. 2023. PMID: 37423881 - Therapeutic potential of PANoptosis: innate sensors, inflammasomes, and RIPKs in PANoptosomes.
Pandeya A, Kanneganti TD. Pandeya A, et al. Trends Mol Med. 2024 Jan;30(1):74-88. doi: 10.1016/j.molmed.2023.10.001. Epub 2023 Nov 15. Trends Mol Med. 2024. PMID: 37977994 Review. - PANoptosis: Emerging mechanisms and disease implications.
Qi Z, Zhu L, Wang K, Wang N. Qi Z, et al. Life Sci. 2023 Nov 15;333:122158. doi: 10.1016/j.lfs.2023.122158. Epub 2023 Oct 6. Life Sci. 2023. PMID: 37806654 Review.
Cited by
- The assembly and activation of the PANoptosome promote porcine granulosa cell programmed cell death during follicular atresia.
Wu H, Han Y, Liu J, Zhao R, Dai S, Guo Y, Li N, Yang F, Zeng S. Wu H, et al. J Anim Sci Biotechnol. 2024 Nov 5;15(1):147. doi: 10.1186/s40104-024-01107-3. J Anim Sci Biotechnol. 2024. PMID: 39497227 Free PMC article. - Inflammasome protein scaffolds the DNA damage complex during tumor development.
Shen C, Pandey A, Enosi Tuipulotu D, Mathur A, Liu L, Yang H, Adikari NK, Ngo C, Jing W, Feng S, Hao Y, Zhao A, Kirkby M, Kurera M, Zhang J, Venkataraman S, Liu C, Song R, Wong JJ, Schumann U, Natoli R, Wen J, Zhang L, Kaakoush NO, Man SM. Shen C, et al. Nat Immunol. 2024 Nov;25(11):2085-2096. doi: 10.1038/s41590-024-01988-6. Epub 2024 Oct 14. Nat Immunol. 2024. PMID: 39402152 - The multiple roles of interferon regulatory factor family in health and disease.
Wang L, Zhu Y, Zhang N, Xian Y, Tang Y, Ye J, Reza F, He G, Wen X, Jiang X. Wang L, et al. Signal Transduct Target Ther. 2024 Oct 9;9(1):282. doi: 10.1038/s41392-024-01980-4. Signal Transduct Target Ther. 2024. PMID: 39384770 Free PMC article. Review. - PANoptosis: a new insight for oral diseases.
Jiang X, Fu T, Huang L. Jiang X, et al. Mol Biol Rep. 2024 Sep 5;51(1):960. doi: 10.1007/s11033-024-09901-y. Mol Biol Rep. 2024. PMID: 39235684 Review. - Innate immune sensing of cell death in disease and therapeutics.
Man SM, Kanneganti TD. Man SM, et al. Nat Cell Biol. 2024 Sep;26(9):1420-1433. doi: 10.1038/s41556-024-01491-y. Epub 2024 Sep 2. Nat Cell Biol. 2024. PMID: 39223376 Review.
References
- Janeway CA Jr. (2013). Pillars article: approaching the asymptote? Evolution and revolution in immunology. Cold spring harb symp quant biol. 1989. 54: 1–13. J Immunol 191, 4475–4487. - PubMed
- Harton JA, Linhoff MW, Zhang J, and Ting JP (2002). Cutting edge: CATERPILLER: a large family of mammalian genes containing CARD, pyrin, nucleotide-binding, and leucine-rich repeat domains. J Immunol 169, 4088–4093. - PubMed
Publication types
MeSH terms
Substances
Grants and funding
- R35 CA253095/CA/NCI NIH HHS/United States
- R01 AI101935/AI/NIAID NIH HHS/United States
- R01 AI124346/AI/NIAID NIH HHS/United States
- R37 AI101935/AI/NIAID NIH HHS/United States
- R01 AI160179/AI/NIAID NIH HHS/United States
- R01 AR056296/AR/NIAMS NIH HHS/United States
LinkOut - more resources
Full Text Sources
Other Literature Sources
Miscellaneous
