Determining the ERK-regulated phosphoproteome driving KRAS-mutant cancer - PubMed (original) (raw)
. 2024 Jun 7;384(6700):eadk0850.
doi: 10.1126/science.adk0850. Epub 2024 Jun 7.
J Nathaniel Diehl 2, Jeffrey A Klomp 1 3, A Cole Edwards 4, Runying Yang 1, Alexis J Morales 1, Khalilah E Taylor 1, Kristina Drizyte-Miller 1, Kirsten L Bryant 1 3, Antje Schaefer 1 3, Jared L Johnson 5 6 7, Emily M Huntsman 7 8, Tomer M Yaron 7 8 9, Mariaelena Pierobon 10, Elisa Baldelli 10, Alex W Prevatte 11, Natalie K Barker 11, Laura E Herring 11, Emanuel F Petricoin 3rd 10, Lee M Graves 1 3 11, Lewis C Cantley 5 6 7, Adrienne D Cox 1 3 4 12, Channing J Der 1 2 3 4, Clint A Stalnecker 1 3
Affiliations
- PMID: 38843329
- PMCID: PMC11301400
- DOI: 10.1126/science.adk0850
Determining the ERK-regulated phosphoproteome driving KRAS-mutant cancer
Jennifer E Klomp et al. Science. 2024.
Abstract
To delineate the mechanisms by which the ERK1 and ERK2 mitogen-activated protein kinases support mutant KRAS-driven cancer growth, we determined the ERK-dependent phosphoproteome in KRAS-mutant pancreatic cancer. We determined that ERK1 and ERK2 share near-identical signaling and transforming outputs and that the KRAS-regulated phosphoproteome is driven nearly completely by ERK. We identified 4666 ERK-dependent phosphosites on 2123 proteins, of which 79 and 66%, respectively, were not previously associated with ERK, substantially expanding the depth and breadth of ERK-dependent phosphorylation events and revealing a considerably more complex function for ERK in cancer. We established that ERK controls a highly dynamic and complex phosphoproteome that converges on cyclin-dependent kinase regulation and RAS homolog guanosine triphosphatase function (RHO GTPase). Our findings establish the most comprehensive molecular portrait and mechanisms by which ERK drives KRAS-dependent pancreatic cancer growth.
Conflict of interest statement
C.J.D. was a consultant/advisory board member for Cullgen, Deciphera Pharmaceuticals, Kestrel Therapeutics, Mirati Therapeutics, Reactive Biosciences, Revere Pharmaceuticals, Revolution Medicines Ribometrics, Sanofi and SHY Therapeutics. C.J.D. has received research funding support from Deciphera Pharmaceuticals, Mirati Therapeutics, Reactive Biosciences, Revolution Medicines, and SpringWorks Therapeutics. A.D.C. has consulted for Eli Lilly and Mirati Therapeutics. M.P. and E.F.P. receive royalties from and are consultants of TheraLink Technologies, Inc. K.L.B. has received research funding support from SpringWorks Therapeutics. E.F.P. is a shareholder and consultant of Avant Diagnostics, TheraLink Technologies, Inc. and Perthera, E.F.P. received funding support from Mirati Therapeutics, Genentech, Inc., and Abbvie, Inc. C.A.S. has received consulting fees from Reactive Biosciences. L.C.C. is a founder and member of the board of directors of Agios Pharmaceuticals and is a founder and receives research support from Petra Pharmaceuticals; is listed as an inventor on a patent (WO2019232403A1, Weill Cornell Medicine) for combination therapy for PI3K-associated disease or disorder, and the identification of therapeutic interventions to improve response to PI3K inhibitors for cancer treatment; is a co-founder and shareholder in Faeth Therapeutics; has equity in and consults for Cell Signaling Technologies, Volastra, Larkspur and 1 Base Pharmaceuticals; and consults for Loxo-Lilly. T.M.Y. is a co-founder and stockholder and is on the board of directors of DESTROKE, an early-stage start-up developing mobile technology for automated clinical stroke detection. J.L.J. has received consulting fees from Scorpion Therapeutics and Volastra Therapeutics. The other authors declare no competing interests.
Figures
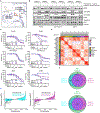
Fig. 1.. ERK signaling is critical for KRAS-regulated PDAC growth.
(A) Crystal structure of ERK2 bound to the ATP analogue ANP; activating ERK2 mutations (and analogous ERK1 mutations) and the TEY activation loop are shown (PDB: 4NIF). (B) Immunoblots showing mutant ERK expression and rescue of downstream signaling in Pa16C, MIA PaCa-2, and UM53 cells with doxycycline (Dox)-inducible activated ERK1SD (R84S/S170D) or ERK2SD (R67S/S153D) treated with the KRASG12D (MRTX1133, 20 nM) or KRASG12C (MRTX1257, 20 nM) inhibitor for 24 hours. Dox (1 μg/mL) was added 24 hours prior to drug treatments. Blots are representative of three or more independent experiments. Quantification of pRSK and MYC are shown in fig. S1C. (C) Cell viability assays of Pa16C, MIA PaCa-2, UM53 cells with Dox-inducible expression of activated ERK1SD (R84S/S170D) or ERK2SD (R67S/S153D) in response to KRASG12C/D (MRTX1257, MRTX1133) or ERK1/2 inhibitor (SCH772984). Dox treatment (1 μg/mL) was added 24 hours prior to drug treatments. Graphs show the mean percent growth of three replicates +/− standard error of the mean. (D) RPPA Spearman correlation coefficients comparing log2(FC) of signals from 147 antibodies for the individual six cell lines and all cell lines considered together. Cells were treated with siRNAs targeting NS (non-specific control), KRAS, MAPK3 (ERK1) and/or MAPK1 (ERK2), for 72 hours as in (fig. S1E). Statistical analysis was performed from four biological replicates. The individual treatments and full protein list can be found in fig. S1G and data S1. (E) RNA transcript expression changes induced by 24-hour KRASG12D inhibition (MRTX1133, 100 nM) versus DMSO control in Pa16C cells expressing activated ERK1SD (cyan), ERK2SD (pink), or GFP control (black). Genes are ranked by expression changes in GFP expressing cells. Dox (1 μg/mL) was added 24 hours prior to drug treatments. Statistical analysis was performed from two biological replicates. Genes shown for ERK1SD and ERK2SD (points) are those with significant DE induced by KRASG12D inhibition in GFP control cells (adj. p-val. < 0.01). (**F**) Venn diagrams representing the overlap between genes upregulated (G12Di UP) or downregulated (G12Di DN) by KRASG12D inhibition in GFP expressing cells (green; |log2FC| > 0.25 and adj. p-val. < 0.01) and genes rescued by ERK1SD (cyan) and ERK2SD (pink). The center overlap (purple) depicts genes rescued by both ERK1SD and ERK2SD, the genes in only the green area are not rescued by either, in the cyan area rescued by only ERK1SD, and in the purple area by only ERK2SD. The term “rescue” indicates an expression change (log2FC) less extreme than the GFP control but no p-values were used to represent the degree of those expression changes.
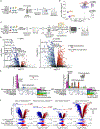
Fig. 2.. Phosphoproteomic determination of the ERK regulated phosphoproteome in KRAS mutant PDAC.
(A) Flow diagram of the MIB/MS experiment was created with
BioRender.com
. (B) MIB/MS analyses of six KRAS mutant cell lines treated for 1 or 24 hours with ERKi (SCH772984, 1 μM). (C) Experimental workflow for proteomics analyses, created with
BioRender.com
. (D) Differentially expressed phosphosites following 1 and 24 hours ERK inhibition in the same six PDAC cell lines as in (A and B). Phosphosites previously reported in the ERK Compendium are highlighted, and top significantly dysregulated sites identified within the ERK Compendium as direct substrates of ERK are labeled. (E) Overlap between ERK-dependent phosphosites (p < 0.05) or phosphoproteins in PDAC and phosphosites/phosphoproteins reported in the CPTAC PDAC dataset (fdr < 0.05), ERK Compendium, PhosphoSitePlus (PSP) regulatory sites, and Post-Translational Signature Database (PTMsigDB). (F) Differentially expressed phosphosites following 24-hour KRASG12C inhibition (MRTX1257, 20 nM, G12Ci) or RAS(ON) multi-selective tri-complex inhibition (RMC-7977, 10 nM, RASi). ERK-dependent phosphosites (p<0.05, 24 h) are annotated by blue (downregulated) or red (upregulated) points. ERK-regulated phosphosites at 1 and 24 hours are annotated as bars below the volcano plot.
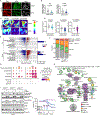
Fig. 3.. The ERK phosphoproteome regulates diverse functional pathways comprised of proteins enriched in ERK binding motifs.
(A) Representative images of pERK (red), total ERK (green), and nuclear DAPI (grey) immunofluorescence in Pa16C cells treated with ERKi (SCH772984, 1 μM) or DMSO for 24 hours (scale bar = 75 μm), quantified in (B) Dashed lines represent median, and statistics represent a Mann-Whitney test on 113–655 individual cells from 5–10 fields of at least two replicates. (C) Representative pseudo-colored FRET intensity of Pa16C cells stably expressing untargeted EKAR4 (EKAR4) or EKAR4 tagged with either a nuclear localization signal (nuc-EKAR4) or nuclear export signal (cyto-EKAR4) treated with ERKi (SCH772984, 1 μM) or DMSO for 4 or 24 hours (scale bar = 20 μm), quantified in (D). Statistical analysis performed as in (B). (E) Subcellular association of phosphoproteins with differentially regulated phosphosites and enrichment (red/blue, p<0.05) at 1 hour and 24 hours ERKi. Statistical analysis of enrichment determined by one-tailed hypergeometric testing and p values corrected by Benjamini-Hochberg. (F) Proportion of phosphosites containing the p[S/T]-P phospho motif together with an ERK-binding D or DEF motif within the phosphoprotein. Proportions were determined within the background of all detected phosphosites, and sites differentially downregulated at 1 hour and 24 hours ERKi (p < 0.01, log2(FC)<0). Statistical analysis of enrichment determined as in (E). (G) Subcellular association of phosphoproteins with ERK binding and phosphorylation motifs as in (F). Point color and size represent relative enrichment and significance of enrichment, respectively. Points are highlighted if statistically enriched (red, adj. p < 0.05). Enrichment was determined using one-tailed hypergeometric enrichment using all detected phosphosites as background. (H) Membership of phosphoproteins within top enriched gene sets for cytoskeleton-associated phosphoproteins with downregulated phosphosites at 1 hour ERKi. Phosphoproteins are colored by the presence of ERK-binding D or DEF motifs and outlined in green if a differentially regulated phosphosite was detected with a p[S/T]-P motif. Size of phosphoproteins is proportional to the number of downregulated phosphosites, and pathways are sized by the number of phosphoprotein members. Differentially regulated phosphosites are also shown and likewise colored green if the phosphosite contains a p[S/T]-P motif. (I) Immunoblots showing mutant ERK expression and downstream signaling in Pa16C expressing dox-inducible ERK1SD, ERK1SDN (R84S/S170D/D338N), and ERK1SDA (R84S/S170D/Y280A) treated with the KRASG12D inhibitor (MRTX1133, 20 nM) for 24 hours. Dox (1 μg/mL) was added 24 hours prior to drug treatments. Blots are representative of three or more independent experiments and quantification of pRSK and MYC are in fig. S3Q. (J) Viability of Dox-inducible ERK1SD, ERK1SDN, and ERK1SDA cell lines treated with a dose escalation of G12Di (MRTX1133). Dox (1 μg/mL) was added 24 hours prior to drug treatments. Graphs show the mean percent growth of three replicates +/− standard error of the mean.
Fig. 4.. ERK regulates a dynamic phosphoproteome by engaging downstream kinases.
(A) Epigenetic regulator, transcription factor, kinase, phosphatase, and E3 ubiquitin ligase phosphoproteins with downregulated phosphosites and their ERK binding DEF and/or D motifs. The number of phosphoproteins containing a downregulated known regulatory phosphorylation is annotated with a red triangle. (B) Relative kinase activities calculated for 303 S/T kinases at 1 hour and 24 hours ERKi using kinase motif specificities (37). Line color represents the direction of change from 1 to 24 hours ERKi, and line transparency represents the magnitude of change. (C) Kinase-substrate networks at 1 and 24 hours ERKi. Networks were constructed using kinase motif specificities (37), kinase-substrate specificities from PhosphoSitePlus (25), kinase-substrate interactions from PhosphoNetworks (38) and BioGRID (39). Nodes are sized and colored by their strength in network, and shape represents protein group. Edges are colored by direction of association with up- or downregulated phosphosites. Edge width represents the magnitude of interaction score. The top quantile of kinases is labeled in each network; text size is scaled with node strength. (D) Comparison of kinase-motif enrichment (log2(freq. factor)) derived from ERK-dependent phosphoproteome versus RAS-dependent phosphoproteomes as shown in Fig 2F. Fill color represents the significance of enrichment in the ERK-dependent phosphoproteome and size represents the significance in the KRASG12C- or RAS-dependent phosphoproteome.
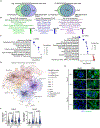
Fig. 5.. ERK signaling is highly integrated with RHO GTPase signaling.
(A) Overlap of KEGG, Gene Ontology (GO), and Reactome gene sets significantly enriched in (p < 0.01, left) or containing any gene associated with (right) phosphoproteins reported in the ERK Compendium (21) or the ERK-dependent PDAC phosphoproteome. Gene set enrichment was determined using one-tailed hypergeometric testing using the entire proteome as background for both phosphoprotein lists; p values corrected by Benjamini-Hochberg. (**B**) Terms of top Reactome gene sets significantly enriched in the ERK Compendium (left), in the ERK dependent PDAC phosphoproteome (middle), or in the ERK dependent PDAC phosphoproteome but not the ERK Compendium (right). Terms are sized and colored by significance of enrichment. (**C**) Signed significance from gene enrichment analysis of up- or downregulated phosphoproteins (log2(FC) < 0 or > 0; adj. p < 0.05) at 1 and 24 hours ERKi. Up- and downregulated phosphoprotein enrichment is represented by fill color (red and blue respectively) with number of phosphoproteins annotated as size by foreground matches. (D) Isolated network for edges connecting to proteins within the Reactome “RHO GTPase cycle” and “RHO GTPase effectors” gene sets with interaction scores greater than one standard deviation. Edges are colored by time point (1 or 24 hours) and phosphosite change (up- or downregulated) and edge-node associations are outlined (Down at 1 hour, Down at 24 hours, Up at 1 hour, Up at 24 hours). Top kinases by strength are labeled and node sized by strength. (E) Representative images of phalloidin (green) and nuclear DAPI (blue) immunofluorescence in Pa14C and Pa16C cells treated with ERKi (1 μM, SCH772984) or DMSO for 24 hours or 72 hours (scale bar = 50 μm). (F) Quantification of relative integrative intensity of F-actin from (E). Solid line represents median, dashed line represents upper and lower quartiles, and statistics represent a Mann-Whitney test on 113–655 individual cells from 5–10 fields of at least two replicates.
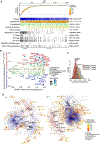
Fig. 6.. Genetic dependencies of the ERK dependent PDAC phosphoproteome.
(A) Annotated Chronos dependency rank plot, ranked by DepMap dependency scores for ERK-regulated phosphoproteins. Median Chronos dependency across 43 KRAS MT PDAC cell lines for each phosphoprotein is represented as a point on the rank plot. The line for each point represents upper and lower quartiles and is colored by the median dependency. Annotations indicate membership in the subcellular compartment or Reactome gene set. Enrichment significance was determined by one-tailed hypergeometric testing of phosphoproteins with median Chronos scores < −0.5 (dotted line); p values corrected by Benjamini-Hochberg. (B) Selectivity of genetic dependencies for ERK regulated phosphoproteins towards KRAS MT or KRAS WT cancers. Cell lines from cancers of the pancreas, large intestine, biliary tract, lung, stomach, endometrium, cervix, or ovary were characterized as either KRAS mutant, including G12A/C/D/R/S/V, G13D, or Q61K/H/L/R mutations, or KRAS WT. The mean difference in Chronos dependency (y-axis) in KRAS MT and KRAS WT cell lines is shown for each ERK-regulated phosphoprotein with respect to the mean Chronos dependency in KRAS MT PDAC (x-axis). Genes are colored and sized by adjusted p values calculated by two-way ANOVA and Tukey’s HSD post hoc test between KRAS MT and KRAS WT cell lines, with cancer type as an independent variable. (C) Density histogram of mean genetic dependencies of the 23 genes with significantly selective dependencies in KRAS MT cancers as shown in (B), separated by KRAS MT PDAC versus other cancers from (B) defined as KRAS MT or KRAS WT. Statistical differences determined by Games-Howell. (D) Kinase-substrate network from 1 and 24 hours ERKi treatments with node size and color representing median genetic dependency of the 43 KRAS MT PDAC cell lines. Edges represent interaction scores as in Fig. 4C.
Similar articles
- Defining the KRAS- and ERK-dependent transcriptome in KRAS-mutant cancers.
Klomp JA, Klomp JE, Stalnecker CA, Bryant KL, Edwards AC, Drizyte-Miller K, Hibshman PS, Diehl JN, Lee YS, Morales AJ, Taylor KE, Peng S, Tran NL, Herring LE, Prevatte AW, Barker NK, Hover LD, Hallin J, Sorokin A, Kanikarla PM, Chowdhury S, Coker O, Lee HM, Goodwin CM, Gautam P, Olson P, Christensen JG, Shen JP, Kopetz S, Graves LM, Lim KH, Wang-Gillam A, Wennerberg K, Cox AD, Der CJ. Klomp JA, et al. Science. 2024 Jun 7;384(6700):eadk0775. doi: 10.1126/science.adk0775. Epub 2024 Jun 7. Science. 2024. PMID: 38843331 Free PMC article. - Transgelin-2 is a novel target of KRAS-ERK signaling involved in the development of pancreatic cancer.
Sun Y, Peng W, He W, Luo M, Chang G, Shen J, Zhao X, Hu Y. Sun Y, et al. J Exp Clin Cancer Res. 2018 Jul 24;37(1):166. doi: 10.1186/s13046-018-0818-z. J Exp Clin Cancer Res. 2018. PMID: 30041673 Free PMC article. - The KRAS-regulated kinome identifies WEE1 and ERK coinhibition as a potential therapeutic strategy in KRAS-mutant pancreatic cancer.
Diehl JN, Klomp JE, Snare KR, Hibshman PS, Blake DR, Kaiser ZD, Gilbert TSK, Baldelli E, Pierobon M, Papke B, Yang R, Hodge RG, Rashid NU, Petricoin EF 3rd, Herring LE, Graves LM, Cox AD, Der CJ. Diehl JN, et al. J Biol Chem. 2021 Nov;297(5):101335. doi: 10.1016/j.jbc.2021.101335. Epub 2021 Oct 22. J Biol Chem. 2021. PMID: 34688654 Free PMC article. - Inhibition of the RAF/MEK/ERK Signaling Cascade in Pancreatic Cancer: Recent Advances and Future Perspectives.
Adamopoulos C, Cave DD, Papavassiliou AG. Adamopoulos C, et al. Int J Mol Sci. 2024 Jan 28;25(3):1631. doi: 10.3390/ijms25031631. Int J Mol Sci. 2024. PMID: 38338909 Free PMC article. Review. - Lysine methylation in cancer: SMYD3-MAP3K2 teaches us new lessons in the Ras-ERK pathway.
Colón-Bolea P, Crespo P. Colón-Bolea P, et al. Bioessays. 2014 Dec;36(12):1162-9. doi: 10.1002/bies.201400120. Epub 2014 Sep 2. Bioessays. 2014. PMID: 25382779 Review.
Cited by
- Special Issue: MAPK Signaling Cascades in Human Health and Diseases.
Seger R. Seger R. Int J Mol Sci. 2024 Oct 18;25(20):11226. doi: 10.3390/ijms252011226. Int J Mol Sci. 2024. PMID: 39457006 Free PMC article. - KRASG12D-driven pentose phosphate pathway remodeling imparts a targetable vulnerability synergizing with MRTX1133 for durable remissions in PDAC.
Jiang X, Wang T, Zhao B, Sun H, Dong Y, Ma Y, Li Z, Wu Y, Wang K, Guan X, Long B, Qin L, Shi W, Shi L, He Q, Liu W, Li M, Xiao L, Zhou C, Sun H, Yang J, Guan J, Zhou H, Yu Z, Jiao Z. Jiang X, et al. Cell Rep Med. 2025 Feb 18;6(2):101966. doi: 10.1016/j.xcrm.2025.101966. Cell Rep Med. 2025. PMID: 39970873 Free PMC article. - From precursor to cancer: decoding the intrinsic and extrinsic pathways of pancreatic intraepithelial neoplasia progression.
Graham S, Dmitrieva M, Vendramini-Costa DB, Francescone R, Trujillo MA, Cukierman E, Wood LD. Graham S, et al. Carcinogenesis. 2024 Nov 22;45(11):801-816. doi: 10.1093/carcin/bgae064. Carcinogenesis. 2024. PMID: 39514554 Free PMC article. Review. - The Selective WEE1 Inhibitor Azenosertib Shows Synergistic Antitumor Activity with KRASG12C Inhibitors in Preclinical Models.
Jameson NM, Kim D, Lee C, Skrable B, Shea A, Guo X, Izadi H, Abed M, Harismendy O, Ma J, Kim DS, Lackner MR. Jameson NM, et al. Cancer Res Commun. 2025 Feb 1;5(2):240-252. doi: 10.1158/2767-9764.CRC-24-0411. Cancer Res Commun. 2025. PMID: 39807828 Free PMC article. - Personalized Medicine in Pancreatic Cancer: The Promise of Biomarkers and Molecular Targeting with Dr. Michael J. Pishvaian.
Cortiana V, Abbas RH, Chorya H, Gambill J, Mahendru D, Park CH, Leyfman Y. Cortiana V, et al. Cancers (Basel). 2024 Jun 26;16(13):2329. doi: 10.3390/cancers16132329. Cancers (Basel). 2024. PMID: 39001391 Free PMC article. Review.
References
- Hayashi A, Hong J, Iacobuzio-Donahue CA, The pancreatic cancer genome revisited. Nat. Rev. Gastroenterol. Hepatol 18, 469–481 (2021). - PubMed
- Drosten M, Barbacid M, Targeting the MAPK Pathway in KRAS-Driven Tumors. Cancer Cell 37, 543–550 (2020). - PubMed
- Klomp JE, Klomp JA, Der CJ, The ERK mitogen-activated protein kinase signaling network: the final frontier in RAS signal transduction. Biochem. Soc. Trans 49, 253–267 (2021). - PubMed
Publication types
MeSH terms
Substances
Grants and funding
- P50 CA257911/CA/NCI NIH HHS/United States
- T32 CA009156/CA/NCI NIH HHS/United States
- K99 CA276700/CA/NCI NIH HHS/United States
- U01 CA199235/CA/NCI NIH HHS/United States
- T32 GM119999/GM/NIGMS NIH HHS/United States
- T32 CA071341/CA/NCI NIH HHS/United States
- R01 GM138520/GM/NIGMS NIH HHS/United States
- R37 CA251877/CA/NCI NIH HHS/United States
- R01 CA042978/CA/NCI NIH HHS/United States
- P01 CA203657/CA/NCI NIH HHS/United States
- R35 CA232113/CA/NCI NIH HHS/United States
- P01 CA117969/CA/NCI NIH HHS/United States
- P30 CA016086/CA/NCI NIH HHS/United States
- F31 CA275260/CA/NCI NIH HHS/United States
- F32 CA232529/CA/NCI NIH HHS/United States
- R35 CA197588/CA/NCI NIH HHS/United States
- F32 CA239328/CA/NCI NIH HHS/United States
- P50 CA196510/CA/NCI NIH HHS/United States
- F30 CA243253/CA/NCI NIH HHS/United States
LinkOut - more resources
Full Text Sources
Medical
Research Materials
Miscellaneous
