The tumorigenic potential and cell growth characteristics of p53-deficient cells are equivalent in the presence or absence of Mdm2 - PubMed (original) (raw)
Comparative Study
The tumorigenic potential and cell growth characteristics of p53-deficient cells are equivalent in the presence or absence of Mdm2
S N Jones et al. Proc Natl Acad Sci U S A. 1996.
Abstract
The Mdm2 oncoprotein forms a complex with the p53 tumor suppressor protein and inhibits p53-mediated regulation of heterologous gene expression. Recently, Mdm2 has been found to bind several other proteins that function to regulate cell cycle progression, including the E2F-1/DP1 transcription factor complex and the retinoblastoma tumor-suppressor protein. To determine whether Mdm2 plays a role in cell cycle control or tumorigenesis that is distinct from its ability to modulate p53 function, we have examined and compared both the in vitro growth characteristics of p53-deficient and Mdm2/p53-deficient fibroblasts, and the rate and spectrum of tumor formation in p53-deficient and Mdm2/p53-deficient mice. We find no difference between p53-deficient fibroblasts and Mdm2/p53-deficient fibroblasts either in their rate of proliferation in culture or in their survival frequency when treated with various genotoxic agents. Cell cycle studies indicate no difference in the ability of the two cell populations to enter S phase when treated with DNA-damaging agents or nucleotide antimetabolites, and p53-deficient fibroblasts and Mdm2/p53-deficient fibroblasts exhibit the same rate of spontaneous immortalization following long-term passage in culture. Finally, p53-deficient mice and Mdm2/p53-deficient mice display the same incidence and spectrum of spontaneous tumor formation in vivo. These results demonstrate that deletion of Mdm2 has no additional effect on cell proliferation, cell cycle control, or tumorigenesis when p53 is absent.
Figures
Figure 1
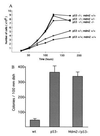
Proliferation of embryonic fibroblasts. (A) Cell growth rates for fibroblasts either wild type, heterozygous, or nullizygous for p53 and Mdm2. The genotype of each cell population is given. Cells nullizygous for p53 proliferated at a higher rate than p53-heterozygous cells, which in turn proliferated at a higher rate than wild-type cells. No difference was detected in the growth rates of p53-deficient fibroblasts that were either wild type, heterozygous, or nullizygous for Mdm2. Cell numbers at each point represent an average of four separate lines of cells, three plates of cells for each line. (B) Colony formation of wild-type (wt), p53-deficient (p53−), and Mdm2- and p53-deficient (Mdm2−/p53−) embryonic fibroblasts grown in conditions of low cell density. Wild-type value represents an average of three plates of four separate lines of cells. Values given for p53− cells and Mdm2−/p53− cells represent an average of three plates each of three lines of cells. Bars indicating standard deviation values are shown.
Figure 2
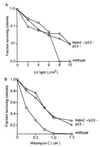
Colony formation of embryonic fibroblasts following DNA damage. (A) Wild-type cells, p53-deficient (p53−) cells, and Mdm2- and p53-deficient (Mdm2−/p53−) cells were plated at low density following treatment with UV radiation. No difference was found between the survival rates of p53− cells and Mdm2−/p53− cells following treatment with UV, whereas a significant difference was seen between the survival of these cells and wild-type cells at higher dosages. Values at each point represent data obtained from duplicate plates of three separate lines of cells for each genotype. (B) Wild-type cells, p53− cells, and Mdm2−/p53− cells were plated at low density following treatment with mitomycin C. No difference was found between the survival rates of p53− cells and Mdm2−/p53− cells following treatment with mitomycin C, whereas a significant difference was seen between the survival of these cells and wild-type cells. Values at each point represent data obtained from duplicate plates of three separate lines of wild-type cells and Mdm2−/p53− cells, or two separate lines of p53− cells.
Figure 3
Cell cycle studies on embryonic fibroblasts. (A) Cycling of wild-type (wt), p53-deficient (p53−), and Mdm2- and p53-deficient (Mdm2−/p53−) fibroblasts. Values represent the ratio of the number of cells present in the G1 or S phase of the cell cycle. (B) Effects of γ-irradiation on the cell cycles of wild-type, p53−, and Mdm2−/p53− fibroblasts. The G1/S ratio of irradiated samples is given relative to untreated G1/S values for each genotype. (C) Effects of PALA on the cell cycles of wild-type, p53−, and Mdm2−/p53− fibroblasts. The G1/S ratio of PALA-treated samples is given relative to untreated G1/S values for each genotype.
Figure 4
Growth of embryonic fibroblasts during long-term passage in culture. Passage 3 fibroblasts that were wild type (○), p53 deficient (□), or Mdm2 and p53 deficient (⋄) were grown following a 3T9 protocol. Each value represents an average of three separate lines of p53− or Mdm2−/p53− fibroblasts. Wild-type values represent the average of two separate lines of fibroblasts.
Figure 5
Spontaneous tumor formation in mice. Tumor incidence curves of normal mice (□) and p53-deficient mice that are wild type (⋄), heterozygous (○, or nullizygous (▵) for functional Mdm2. Student’s_t_ test indicated no significant difference in the rate of tumor incidence between the various p53-deficient mouse populations.
Similar articles
- mdm2 deletion does not alter growth characteristics of p53-deficient embryo fibroblasts.
McMasters KM, Montes de Oca Luna R, Peña JR, Lozano G. McMasters KM, et al. Oncogene. 1996 Oct 17;13(8):1731-6. Oncogene. 1996. PMID: 8895519 - Overexpression of Mdm2 in mice reveals a p53-independent role for Mdm2 in tumorigenesis.
Jones SN, Hancock AR, Vogel H, Donehower LA, Bradley A. Jones SN, et al. Proc Natl Acad Sci U S A. 1998 Dec 22;95(26):15608-12. doi: 10.1073/pnas.95.26.15608. Proc Natl Acad Sci U S A. 1998. PMID: 9861017 Free PMC article. - Adenovirus-mediated E2F-1 gene transfer inhibits MDM2 expression and efficiently induces apoptosis in MDM2-overexpressing tumor cells.
Yang HL, Dong YB, Elliott MJ, Liu TJ, Atienza C Jr, Stilwell A, McMasters KM. Yang HL, et al. Clin Cancer Res. 1999 Aug;5(8):2242-50. Clin Cancer Res. 1999. PMID: 10473112 - The mdm2 proto-oncogene.
Haines DS. Haines DS. Leuk Lymphoma. 1997 Jul;26(3-4):227-38. doi: 10.3109/10428199709051772. Leuk Lymphoma. 1997. PMID: 9322885 Review. - MDM2 oncogene as a novel target for human cancer therapy.
Zhang, Wang H. Zhang, et al. Curr Pharm Des. 2000 Mar;6(4):393-416. doi: 10.2174/1381612003400911. Curr Pharm Des. 2000. PMID: 10788589 Review.
Cited by
- The gut-enriched Kruppel-like factor (Kruppel-like factor 4) mediates the transactivating effect of p53 on the p21WAF1/Cip1 promoter.
Zhang W, Geiman DE, Shields JM, Dang DT, Mahatan CS, Kaestner KH, Biggs JR, Kraft AS, Yang VW. Zhang W, et al. J Biol Chem. 2000 Jun 16;275(24):18391-8. doi: 10.1074/jbc.C000062200. J Biol Chem. 2000. PMID: 10749849 Free PMC article. - Cell Death and the p53 Enigma During Mammalian Embryonic Development.
Raj S, Jaiswal SK, DePamphilis ML. Raj S, et al. Stem Cells. 2022 Mar 31;40(3):227-238. doi: 10.1093/stmcls/sxac003. Stem Cells. 2022. PMID: 35304609 Free PMC article. Review. - Enhanced Mdm2 activity inhibits pRB function via ubiquitin-dependent degradation.
Uchida C, Miwa S, Kitagawa K, Hattori T, Isobe T, Otani S, Oda T, Sugimura H, Kamijo T, Ookawa K, Yasuda H, Kitagawa M. Uchida C, et al. EMBO J. 2005 Jan 12;24(1):160-9. doi: 10.1038/sj.emboj.7600486. Epub 2004 Dec 2. EMBO J. 2005. PMID: 15577944 Free PMC article. - JNK targets p53 ubiquitination and degradation in nonstressed cells.
Fuchs SY, Adler V, Buschmann T, Yin Z, Wu X, Jones SN, Ronai Z. Fuchs SY, et al. Genes Dev. 1998 Sep 1;12(17):2658-63. doi: 10.1101/gad.12.17.2658. Genes Dev. 1998. PMID: 9732264 Free PMC article. - Phosphorylation of serine 18 regulates distinct p53 functions in mice.
Sluss HK, Armata H, Gallant J, Jones SN. Sluss HK, et al. Mol Cell Biol. 2004 Feb;24(3):976-84. doi: 10.1128/MCB.24.3.976-984.2004. Mol Cell Biol. 2004. PMID: 14729946 Free PMC article.
References
- Cahilly-Snyder L, Yang-Feng T, Francke U, George D L. Somatic Cell Mol Genet. 1987;13:235–244. - PubMed
- Oliner J D, Kinzler K W, Meltzer P S, George D L, Vogelstein B. Nature (London) 1992;358:80–83. - PubMed
- Leach F S, Tokino T, Meltzer P, Burrell M, Oliner J D, Smith S, Hill D E, Sidransky D, Kinzler K W, Vogelstein B. Cancer Res. 1993;53:2231–2234. - PubMed
Publication types
MeSH terms
Substances
LinkOut - more resources
Full Text Sources
Molecular Biology Databases
Research Materials
Miscellaneous


