Central Tendency in Statistics Mean, Median, Mode (original) (raw)
Last Updated : 25 Sep, 2025
Central Tendencies are the numerical values that are used to represent a large collection of numerical data. These numerical values are called measures of central tendency or average values. A centralor average value of any statistical data or series is the variable's value representative of the entire data or its associated frequency distribution.
Some commonly used measures of central tendency are:
- **Mean
- **Median
- **Mode
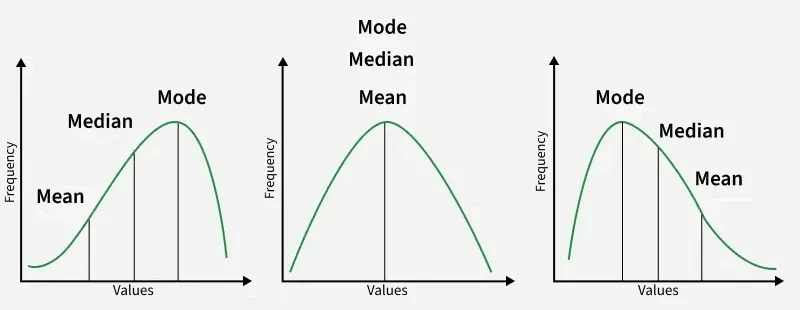
Graphical Representation of Mean Median and Mode
Mean
The mean is a statistical measure used to determine the average value in a dataset. It represents the central or typical value of the data. While the arithmetic mean is the most common, there are also other types like the geometric mean and harmonic mean. These are calculated differently, depending on the situation. It is sensitive to outliers, i.e, if there are extreme values in our dataset then it could cause a different mean rather than the typical mean.
**Note_: Outliers are data points that differ significantly from the majority of the data, often appearing as extreme values
**1. **Arithmetic Mean: This is just the sum of all the values in the dataset, divided by how many values there are. It's the most commonly used average.
\bar{x} = \frac{\sum x_i}{N}
Where:
- \Sigma x_i is the sum of all the observations.
- N is the total number of observations.
**2. **Geometric Mean: This one is calculated by multiplying all the values together and then taking the nnn-th root of the total, depending on how many values you have.
\text{G.M.} = \left( \prod_{i=1}^n x_i \right)^{\frac{1}{n}}
Where:
- x_1,x_2,\dots,x_n are the values.
- n is the number of values.
**3. **Harmonic Mean: This is the average of the reciprocals of the values, which is helpful when dealing with things like rates or speeds.
\text{H.M.} = \frac{n}{\sum_{i=1}^n \frac{1}{x_i}}
Where:
- x_1,x_2,\dots,x_n are the values.
- n is the number of values.
Mean for Ungrouped Data
Mean for ungrouped data, also known as the arithmetic mean (\bar{x}), is calculated by summing up all individual values in the dataset and dividing the sum by the total number of values. This provides a single representative value that reflects the central tendency of the data. It's commonly used to understand the average value or typical value of a given set of observations.
Formula for same is,
\bold{\bar{x} = \frac{\sum x_i}{N}}
OR
Mean = Sum of all Observations ÷ Total number of Observations
**Example: If there are 5 observations, which are 27, 11, 17, 19, and 21 then the mean (\bar{x} ) is given by
\bar{x} = (27 + 11 + 17 + 19 + 21) ÷ 5
⇒ \bar{x} = 95 ÷ 5
⇒ \bar{x} = 19
Mean for Grouped Data
Mean (\bar{x}) is defined for the grouped data as the sum of the product of observations (xi) and their corresponding frequencies (fi) divided by the sum of all the frequencies (fi).
\bold{\bar{x} = \frac{\sum f_i x_i}{\sum f_i}}
**Example: If the values (x i ) of the observations and their frequencies (f i ) are given as follows:
| xi | 4 | 6 | 15 | 10 | 9 |
|---|---|---|---|---|---|
| fi | 5 | 10 | 8 | 7 | 10 |
then Arithmetic mean (\bar{x}) of the above distribution is given by
\bar{x} = (4×5 + 6×10 + 15×8 + 10×7 + 9×10) ÷ (5 + 10 + 8 + 7 + 10)
⇒ \bar{x} = 360 ÷ 40
⇒ \bar{x} = 9
Properties of Mean (Arithmetic)
There are various properties of Arithmetic Mean, some of which are as follows:
- **Sum of Deviations: The sum of deviations from the mean is always zero:
\sum (x_i - \bar{x}) = 0
- **Adding a Constant: If a constant a is added to each observation, the new mean becomes:
\bar{x'} = \bar{x} + a
- **Subtracting a Constant: If a constant a is subtracted from each observation, the new mean becomes:
\bar{x'} = \bar{x} - a
- **Multiplying by a Constant: If each observation is multiplied by a, the new mean becomes:
\bar{x'} = \bar{x} \times a
- **Dividing by a Constant: If each observation is divided by a, the new mean becomes:
\bar{x'} = \frac{\bar{x}}{a}
The median is the middle value in a set of numbers when they’re arranged in order, either from smallest to largest or vice versa. If there’s an odd number of numbers, the median is the one right in the middle. If there’s an even number, the median is the average of the two middle numbers.
Median of Ungrouped Data
To calculate the Median****,** the observations must be arranged in ascending or descending order. If the total number of observations is N then there are two cases
**Case 1: N is Odd
Median = Value of observation at [(n + 1) ÷ 2]th Position
\text{Median} = \left\lfloor \frac{(n+1)}{2} \right\rfloor^{th} \text{Term}
**Case 2: N is Even
Median = Arithmetic mean of Values of observations at (n ÷ 2)th and [(n ÷ 2) + 1]th Position
\text{Median} = \frac{\left[ \left( \frac{n}{2} \right)^{th} \text{ Term} + \left\{ \left( \frac{n}{2} \right) + 1 \right\}^{th} \text{ Term} \right]}{2}
**Example 1: If the observations are 25, 36, 31, 23, 22, 26, 38, 28, 20, 32 then the Median is given by
Arranging data in ascending order: 20, 22, 23, 25, **26, **28, 31, 32, 36, 38
N = 10 which is even then
Median = Arithmetic mean of values at (10 ÷ 2)th and [(10 ÷ 2) + 1]th position
⇒ Median = (26 + 28) ÷ 2
⇒ Median = 27
**Example 2: If the observations are 25, 36, 31, 23, 22, 26, 38, 28, 20 then the Median is given by
Arranging the data in ascending order: 20, 22, 23, 25, **26, 28, 31, 36, 38
N = 9 which is odd then
⇒ Median = Value at 5th position
⇒ Median = 26
Median of Grouped Data
Median of Grouped Data is given as follows:
\bold{Median =l+ \frac{N/2 - c_f}{f} \times h}
where,
- **l is Lower limit of median class
- **n is Total number of observations
- **c f is Cumulative frequency of the preceding class
- **f is Frequency of each class
- **h is Class size
**Example: Calculate the median for the following data.
| **Class | 10 - 20 | 20 - 30 | 30 - 40 | 40 - 50 | 50 - 60 |
|---|---|---|---|---|---|
| Frequency | 5 | 10 | 12 | 8 | 5 |
**Solution:
Create the following table for the given data.
**Class **Frequency **Cumulative Frequency 10 - 20 5 5 20 - 30 10 15 30 - 40 12 27 40 - 50 8 35 50 - 60 5 40 As n = 40 and n/2 = 20,
Thus, 30 - 40 is the median class.l = 30, cf = 15, f = 12, and h = 10
Putting the values in the formula
Median = 30 + (20 - 15)/12) × 10
⇒ Median = 30 + 4.17
⇒ Median = 34.17**So, median value for this data set is 34.17
Mode
Mode is the value of the observation that occurs with the highest frequency. In other, that observation of the data occurs the maximum number of times in a dataset.
Mode of Ungrouped Data
Mode of Ungrouped Data can be simply calculated by observing the observation with the highest frequency. Let's see an example of the calculation of the mode of ungrouped data.
**Example: Find the mode of observations 5, 3, 4, 3, 7, 3, 5, 4, 3.
**Solution:
Create a table with each observation with its frequency as follows:
xi 5 3 4 7 fi 2 4 2 1 Since 3 has occurred a maximum number of times i.e. 4 times in the given data;
**Hence, Mode of the given ungrouped data is 3.
Mode of Grouped Data
Formula to find the mode of the grouped data is:
\bold{Mode = l +\left [\frac{f_1-f_0}{2f_1-f_0-f_2}\right]×h}
where,
- **l is the lower class limit of modal class
- **h is the class size
- **f 1 is the frequency of modal class
- **f 0 is the frequency of class which proceeds the modal class
- **f 2 is the frequency of class which succeeds the modal class
**Example: Find the mode of the dataset which is given as follows.
| Class Interval | 10-20 | 20-30 | 30-40 | 40-50 | 50-60 |
|---|---|---|---|---|---|
| Frequency | 5 | 8 | 12 | 16 | 10 |
**Solution:
As class interval with the highest frequency is 40-50, which has a frequency of 16. Thus, 40-50 is the modal class.
Thus, **l = 40 , **h = 10 , **f 1 = 16 , **f 0 = 12 , **f 2 = 10Plugging in the values in formula \bold{Mode = l +\left [\frac{f_1-f_0}{2f_1-f_0-f_2}\right]×h} , we get
Mode = 40 + (16 - 12)/(2 × 16 - 12 - 10) × 10
⇒ Mode = 40 + (4/10)×10
⇒ Mode = 44**Therefore, mode for this set of data is 44.
Differences between Mean, Median and Mode
Lets see the differences between mean, median and mode,
| Aspect | Mean | Median | Mode |
|---|---|---|---|
| Definition | The sum of all values divided by the number of values. | The middle value when the data is sorted. | The value that appears most frequently. |
| Sensitivity to Outliers | Very Sensitive | Less sensitive | Not sensitive |
| Use Case | Used for normally distributed data | Used for skewed distributions or ordinal data | Used for categorical or non-normally distributed data |
| Data Type | Works with interval and ratio data | Works with ordinal, interval, and ratio data | Works with any type of data (nominal, ordinal, interval, ratio) |
| Uniqueness | Usually one mean (except with multimodal distributions) | One median (if odd number of values, two medians if even) | May have one or more modes (bimodal, trimodal, etc.) |
**Empirical Relation Between Measures of Central Tendency
Three central tendencies are related to each other by the empirical formula which is given as follows:
**2 × Mean + Mode = 3 × Median
Formula is used to calculate one of the central tendencies when two other central tendencies are given.