Descriptive Statistic for Data Science (original) (raw)
Last Updated : 20 May, 2026
Statistics is the foundation of data science. Descriptive statistics are simple tools that help us understand and summarize data. They show the basic features of a dataset, like the average, highest and lowest values and how spread out the numbers are. It's the first step in making sense of information.

Descriptive Statistic
Types of Descriptive Statistics
There are three categories for standard classification of descriptive statistics methods, each serving different purposes in summarizing and describing data. They help us understand:
- Where the data centers (Measures of Central Tendency)
- How spread out the data is (Measure of Variability)
- How the data is distributed (Measures of Frequency Distribution)
**1. Measures of Central Tendency
Statistical values that describe the central position within a dataset. There are three main measures of central tendency:
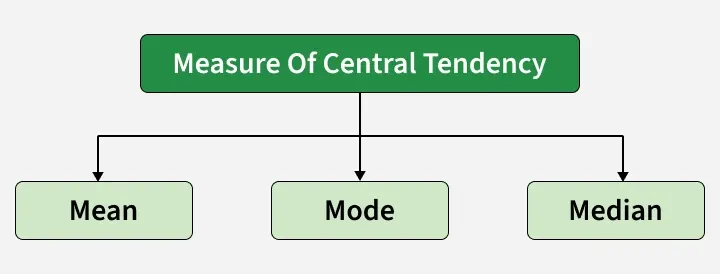
Measures of Central Tendency
**Mean****:** is the sum of observations divided by the total number of observations. It is also defined as average which is the sum divided by count.
\bar{x}=\frac{\sum x}{n}
where,
- x = Observations
- n = number of terms
Let's look at an example of how can we find the mean of a data set using python code implementation. Before its implementation we should have some basic knowledge about numpy and scipy.
Python `
import numpy as np
Sample Data
arr = [5, 6, 11]
Mean
mean = np.mean(arr)
print("Mean = ", mean)
`
Output
Mean = 7.333333333333333
**Mode: The most frequently occurring value in the dataset. It’s useful for categorical data and in cases where knowing the most common choice is crucial.
Python `
import scipy.stats as stats
sample Data
arr = [1, 2, 2, 3]
Mode
mode = stats.mode(arr) print("Mode = ", mode)
`
**Output:
Mode = ModeResult(mode=array([2]), count=array([2]))
**Median: The median is the middle value in a sorted dataset. If the number of values is odd, it's the center value, if even, it's the average of the two middle values. It's often better than the mean for skewed data.
Python `
import numpy as np
sample Data
arr = [1, 2, 3, 4]
Median
median = np.median(arr)
print("Median = ", median)
`
**Note : All implementations are performed using numpy library in python. If you want to learn and understand more about it. Refer to the link.
Central tendency measures are the foundation for understanding data distribution and identifying anomalies. For example, the mean can reveal trends, while the median highlights skewed distributions.
2. Measure of Variability
Knowing not just where the data centers but also how it spreads out is important. Measures of variability, also called measures of dispersion, help us spot the spread or distribution of observations in a dataset. They identifying outliers, assessing model assumptions and understanding data variability in relation to its mean. The key measures of variability include:
**1. **Range : describes the difference between the largest and smallest data point in our data set. The bigger the range, the more the spread of data and vice versa. While easy to compute range is sensitive to outliers. This measure can provide a quick sense of the data spread but should be complemented with other statistics.
Range = Largest data value - smallest data value
Python `
import numpy as np
Sample Data
arr = [1, 2, 3, 4, 5]
Finding Max
Maximum = max(arr)
Finding Min
Minimum = min(arr)
Difference Of Max and Min
Range = Maximum-Minimum print("Maximum = {}, Minimum = {} and Range = {}".format( Maximum, Minimum, Range))
`
Output
Maximum = 5, Minimum = 1 and Range = 4
2. **Variance: is defined as an average squared deviation from the mean. It is calculated by finding the difference between every data point and the average which is also known as the mean, squaring them, adding all of them and then dividing by the number of data points present in our data set.
\sigma ^ 2 = \frac{\sum\left(x-\mu \right )^2}{N}
where,
- x -> Observation under consideration
- N -> number of terms
- μ -> Mean Python `
import statistics
sample data
arr = [1, 2, 3, 4, 5]
variance
print("Var = ", (statistics.variance(arr)))
`
3. **Standard deviation: Standard deviation measures how much the data values differ from the mean. It is widely used in statistics and machine learning to understand data spread and model performance.
- It is defined as the square root of variance.
- A low standard deviation means values are close to the mean.
- A high standard deviation indicates greater variation in the dataset
\sigma = \sqrt{\frac{\sum \left(x-\mu \right )^2}{N}}
where,
- x = Observation under consideration
- N = number of terms
- μ = Mean Python `
import statistics arr = [1, 2, 3, 4, 5] print("Std = ", (statistics.stdev(arr)))
`
Output
Std = 1.5811388300841898
Variability measures are important in residual analysis to check how well a model fits the data.
3. Measures of Frequency Distribution
A frequency distribution table is a summarized way to show how data points are distributed across different categories or intervals. It helps to identify patterns, outliers and the overall structure of the dataset. It's often the first step in understanding the dataset before applying more advanced analytical methods or creating visualizations like histograms or pie charts.
**Frequency Distribution Table Includes measure like:
- Data intervals or categories
- Frequency counts
- Relative frequencies (percentages)
- Cumulative frequencies when needed