Covariance and Correlation (original) (raw)
Last Updated : 8 Apr, 2026
Covariance and correlation are the two key concepts in Statistics that help us analyze the relationship between two variables. Covariance measures how two variables change together, indicating whether they move in the same or opposite directions.

Relationship between Independent and dependent variables
To understand this relationship better, consider factors like sunlight, water and soil nutrients (as shown in the image), which are independent variables that influence plant growth, which is our dependent variable.
What is Covariance
Covariance measures how two random variables change together. It is calculated by averaging the product of their deviations from their means. A positive value means they move in the same direction, while a negative value means they move in opposite directions.
- It can take any value between - infinity to +infinity, where the negative value represents the negative relationship whereas a positive value represents the positive relationship.
- it indicates the direction of a linear relationship, but it does not measure its strength in a standardized way.”
- It gives the direction of relationship between variables.
Covariance Formula
**1. Sample Covariance
\text{Cov}_S(X, Y) = \frac{1}{n - 1} \sum_{i=1}^{n} (X_i - \overline{X})(Y_i - \overline{Y})
**Where:
- X_i: The i^{th} value of the variable X in the sample.
- Y_i: The i^{th} value of the variable Y in the sample.
- \overline{X}: The sample mean of variable X (i.e., the average of all X_i values in the sample).
- \overline{Y}: The sample mean of variable Y (i.e., the average of all Y_i values in the sample).
- n: The number of data points in the sample.
- \sum: The summation symbol means we sum the products of the deviations for all the data points.
- n - 1: This is the degrees of freedom. When working with a sample, we divide by n - 1 to correct for the bias introduced by estimating the population covariance based on the sample data. This is known as Bessel's correction.
**2. Population Covariance
\text{Cov}_P(X, Y) = \frac{1}{n} \sum_{i=1}^{n} (X_i - \mu_X)(Y_i - \mu_Y)
**Where:
- X_i: The i^{th} value of the variable X in the population.
- Y_i: The i^{th} value of the variable Y in the population.
- \mu_X: The population mean of variable X (i.e., the average of all X_i values in the population).
- \mu_Y: The population mean of variable Y (i.e., the average of all Y_i values in the population).
- n: The total number of data points in the population.
- \sum: The summation symbol means we sum the products of the deviations for all the data points.
- n: In the case of population covariance, we divide by n because we are using the entire population data. There’s no need for Bessel’s correction since we’re not estimating anything.
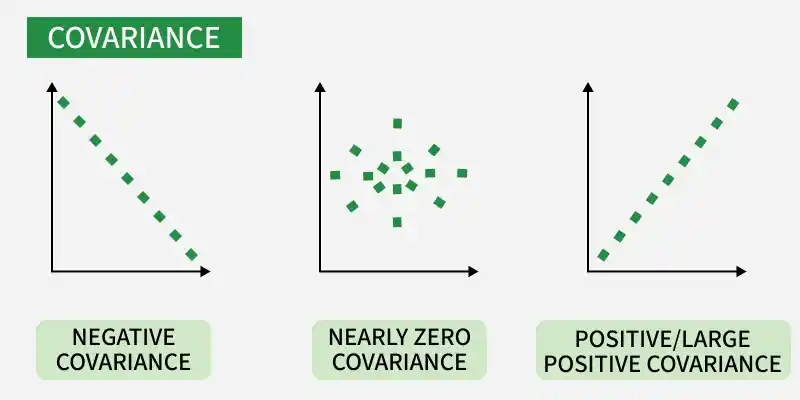
Types of Covariance
- **Positive Covariance: When one variable increases, the other variable tends to increase as well and vice versa.
- **Negative Covariance: When one variable increases, the other variable tends to decrease.
- **Zero Covariance: There is no linear relationship between the two variables; they move independently of each other.
Example
Covariance
What is Correlation
Correlation is a standardized measure of the strength and direction of the linear relationship between two variables. It is derived from covariance and ranges between -1 and 1. Unlike covariance, which only indicates the direction of the relationship, correlation provides a standardized measure.
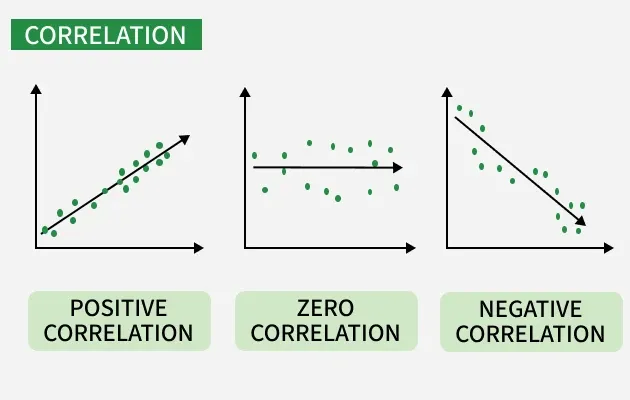
- **Positive Correlation (close to +1): As one variable increases, the other variable also tends to increase.
- **Negative Correlation (close to -1): As one variable increases, the other variable tends to decrease.
- **Zero Correlation: There is no linear relationship between the variables.
The correlation coefficient \rho for variables X and Y is defined as:
- Correlation takes values between -1 to +1, wherein values close to +1 represents strong positive correlation and values close to -1 represents strong negative correlation.
- The variables may be negatively related (i.e., move in opposite directions).
- It gives the direction and strength of relationship between variables.
Correlation Formula
\text{Corr}(x, y) =\frac{\sum_{i=1}^{n} (x_i - \bar{x})(y_i - \bar{y})}{\sqrt{\sum_{i=1}^{n} (x_i - \bar{x})^2 \; \sum_{i=1}^{n} (y_i - \bar{y})^2}}
Here,
- x' and y' = mean of given sample set
- n = total no of sample
- x_i and y_i = individual sample of set
Example
Correlation
Covariance vs. Correlation
| Covariance | Correlation |
|---|---|
| Covariance is a measure of how much two random variables vary together | Correlation is a statistical measure that indicates how strongly two variables are related. |
| Involves the relationship between two variables or data sets | Involves the relationship between multiple variables as well Correlation (specifically Pearson correlation) measures the relationship between two variables. |
| Lie between -infinity and +infinity | Lie between -1 and +1 |
| Measure of correlation | Scaled version of covariance |
| Provides direction of relationship | Provides direction and strength of relationship |
| Dependent on scale of variable | Independent on scale of variable |
| Have dimensions | Dimensionless |
They key difference is that Covariance shows the direction of the relationship between variables, while correlation shows both the direction and strength in a standardized form.
Applications of Covariance
- **Finance: Helps analyze how assets move together (risk diversification)
- **Economics: Studies relationships between economic indicators
- **Signal Processing: Used for analyzing patterns in signals
- **Environmental Science: Examines relationships like temperature vs humidity
Applications of Correlation
- **Market Analysis: Understand customer behavior vs sales
- **Healthcare: Analyze relationships between health variables
- **Weather Forecasting: Study links between weather factors
- **Machine **Learning: Feature selection based on relationships