Power BI Excel Integration (original) (raw)
Last Updated : 23 Jul, 2025
Power BI and Excel integration combine the data visualization and reporting capabilities of Power BI with the spreadsheet functionality of Excel. By linking the two users can analyze and manipulate Power BI data directly within Excel. This is vey useful tool for those who prefer working in Excel but still want the benefits of Power BI’s interactive visuals and data analysis.
Why Integrate Power BI with Excel?
- **Easy Data Access: You can pull your Power BI data into Excel at any time, so it's simpler to analyze and manipulate.
- **Improved Customization: Excel gives you more flexibility with formulas and pivot tables, which may be helpful for deeper analysis or reporting.
- **Current Data: You don't have to update your Excel reports manually once connected, the Power BI data remains current.
**Steps for Power BI and Excel Integration
**Step 1: Open Power BI Workspace
Open Power BI Workspace where you are looking to integrate your data. Click on "Create Data" to begin inserting data from a source such as an Excel file or other data source that you're utilizing. You may also paste or insert your data manually.
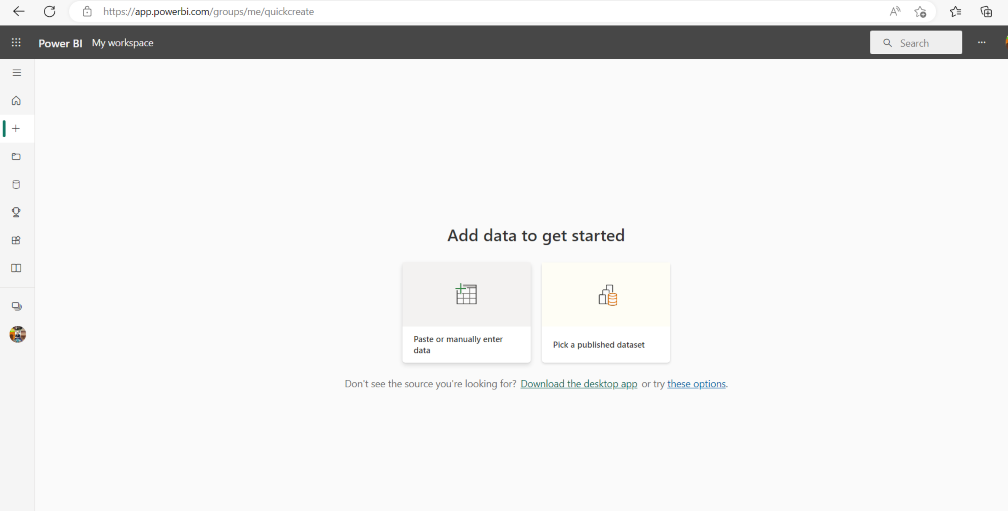
Figure-01 : Create data
**Step 2: Enter Data into Power BI
When you’ve select "Create Data" you’ll see a new interface where you can enter your data in rows and columns. Input your data as required and then click the "Create a Report" button to start visualizing the data within Power BI.
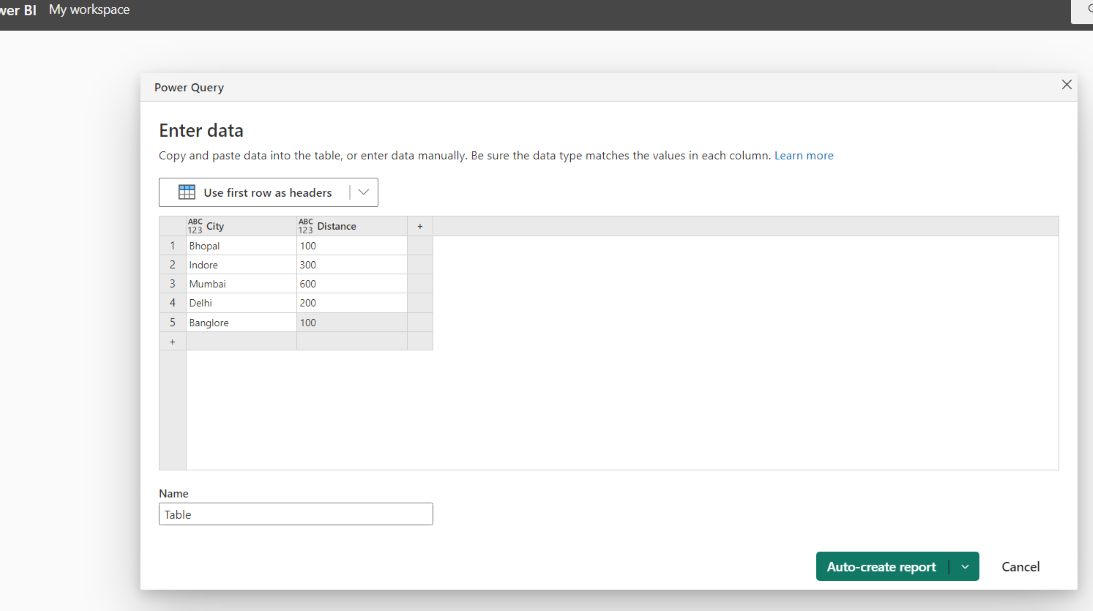
Figure-02 : Enter Data
**Step 3: Review the Created Report
Power BI will process your data and generate an interactive report consist of visuals such as charts, graphs and summaries that help you spot trends and analyze data patterns. Review your created report to ensure it meets your analysis needs.
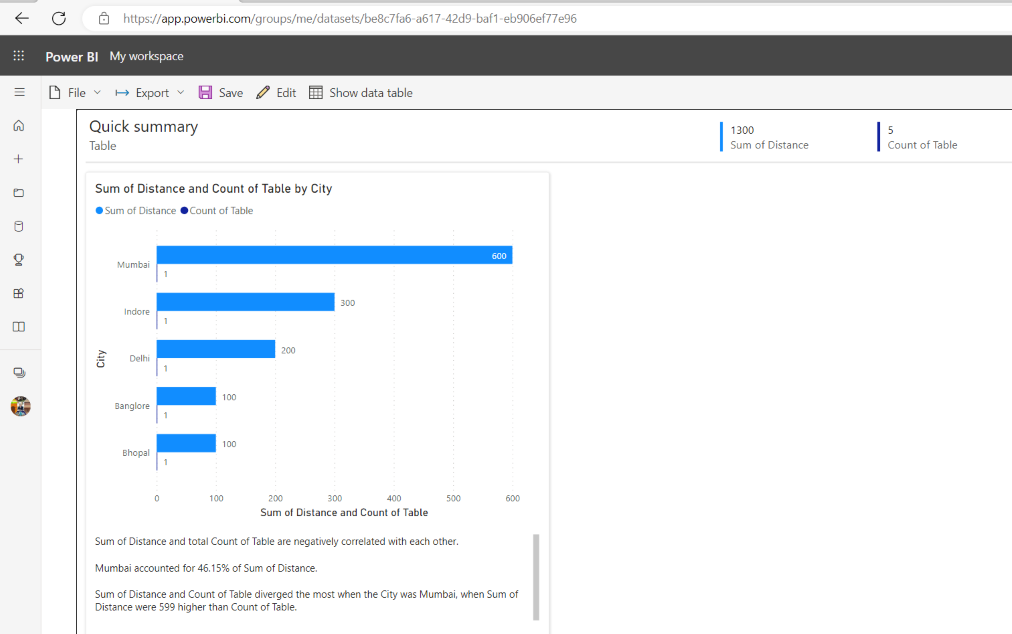
Figure-03 : Quick Summary
**Step 4: Export to Excel
When you’re satisfied with the report, you can export the data to Excel for further analysis. Click on the "Export" button and select the "Analyze in Excel" option. This will allow you to download the data and open it in Excel for additional analysis.
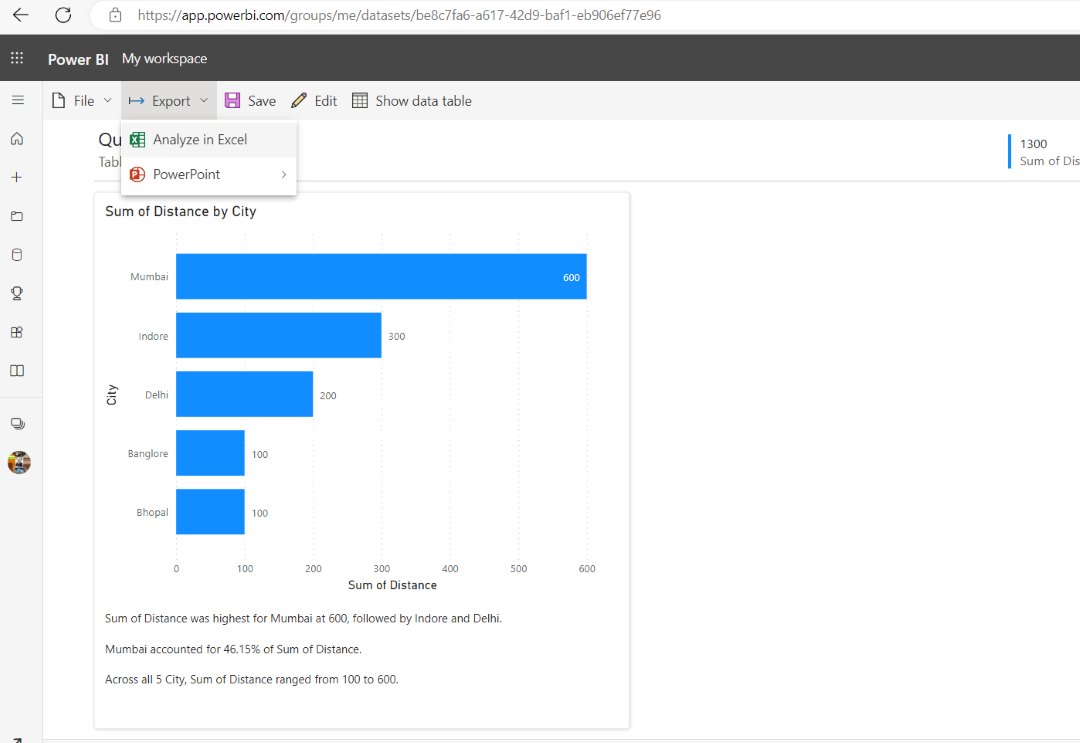
Figure-04: Analyze in Excel
**Step 5: Open in Excel
After the export process is complete it will show that your data is ready for use in Excel. You can then click on "Open in Excel for the Web," and the data will automatically load into an Excel workbook.
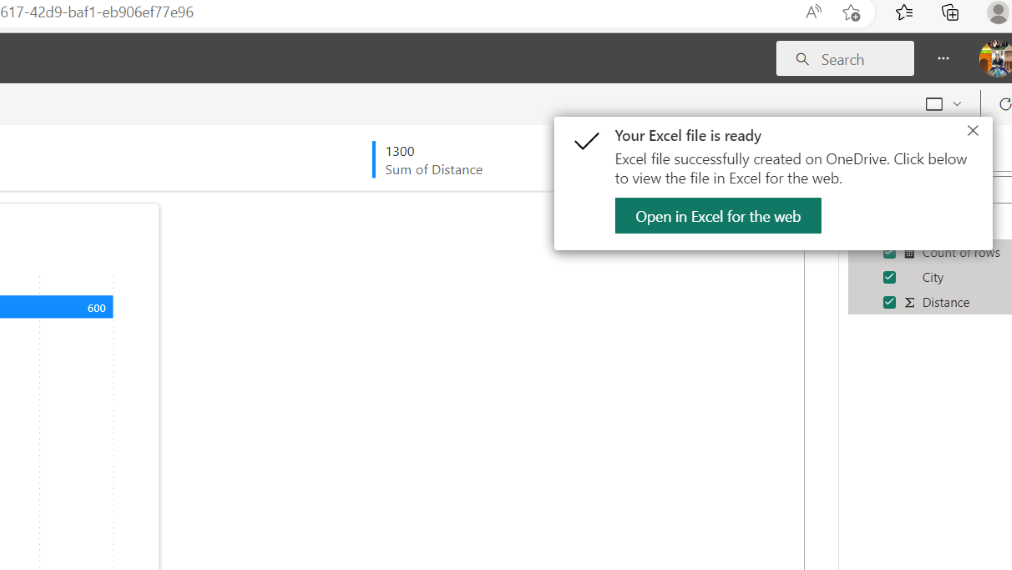
Figure-05 : Ready excel
**Step 6: Refresh Queries
When the data is loaded into Excel you see a prompt to refresh the queries. Simply click "Yes" to allow Excel to connect to the Power BI dataset and ensure that you have the up to date information.
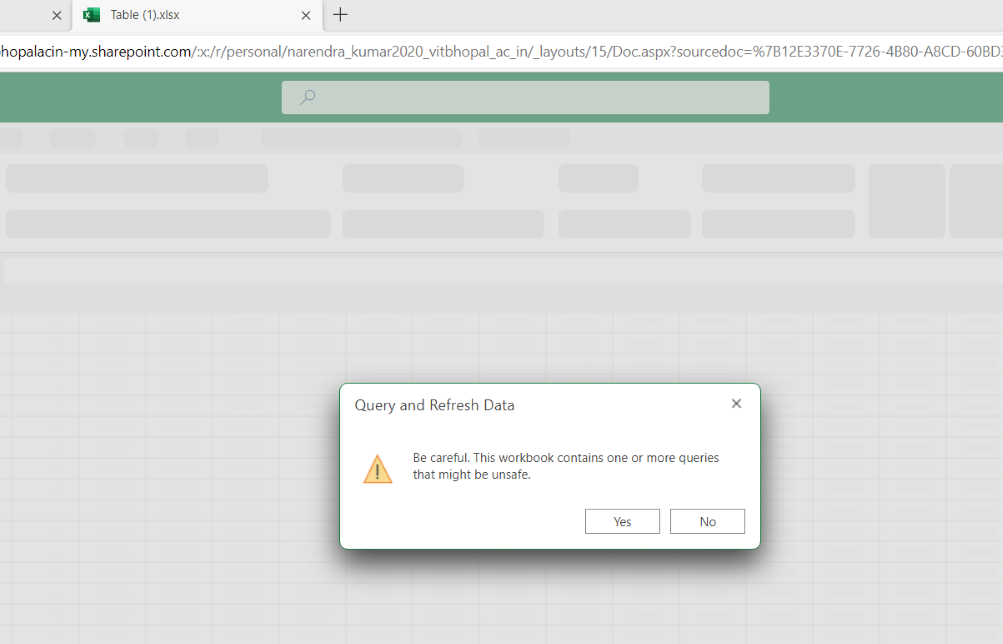
Figure-06 : Refresh Query
**Step 7: Analyzing Data in Excel
Now that Power BI data is integrated into Excel you can begin analyzing it within the familiar Excel environment. For example by selecting a column like "City," you can view all the relevant data for that column and perform your analysis using Excel's features like sort, filter and create pivot tables.
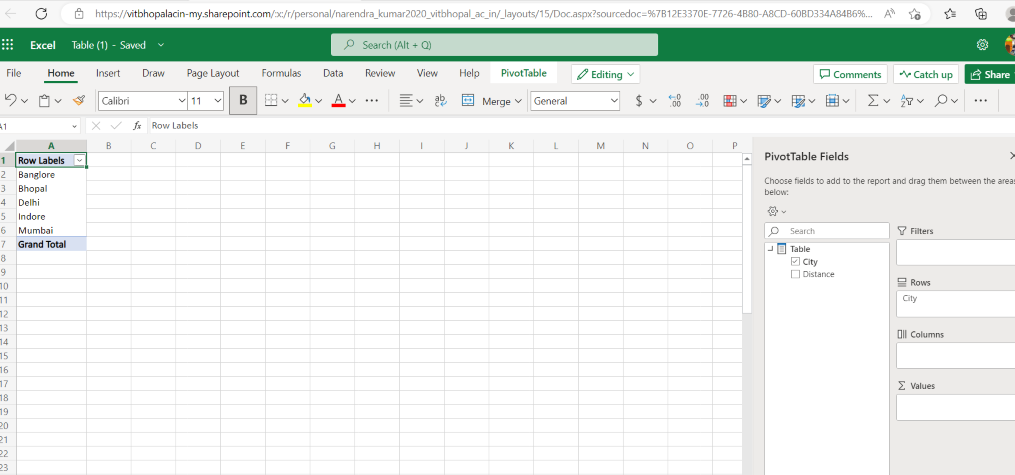
Figure-07 : Column data
**Step 8: Transform Data (Optional)
If you need to adjust how the data is displayed for example changing rows into columns you can use Excel’s features to rearrange the data. By selecting and entering the column names in the appropriate box you can reorganize the data for clear analysis or reporting.
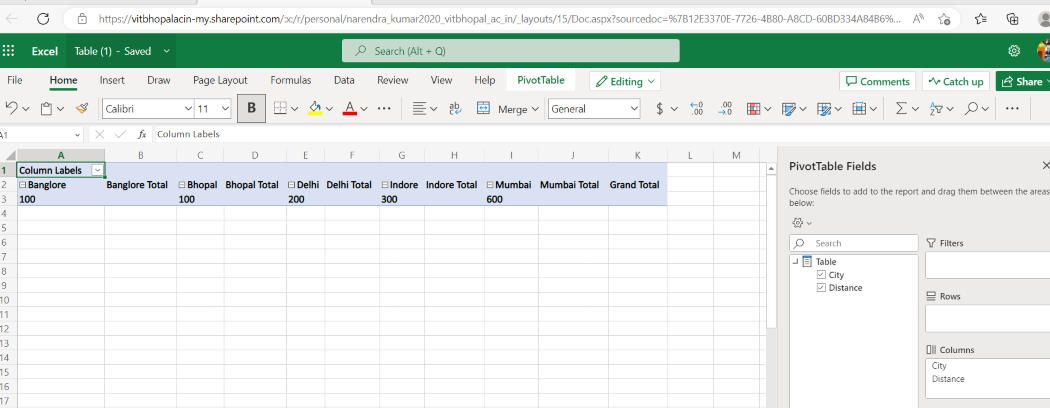
Figure-08 : Row to column
In this above way we can do Integration of Power BI and Excel.