Variance (original) (raw)
Last Updated : 24 Feb, 2026
Variance is a number that tells us how spread out the values in a data set are from the mean (average). It shows whether the numbers are close to the average or far away from it.
- If the variance is small, it means most numbers are close to the mean. If the variance is large, it means the numbers are spread out more widely.
- A higher variance indicates greater variability, meaning the data is spread, while a lower variance suggests the data points are closer to the mean.
The following image depicts the variance in a normal distribution, illustrating how data points are spread around the mean (μ).

Variance
- It shows the probability density across different standard deviations (σ) from the mean, with the curve becoming wider as variance increases and narrower as variance decreases.
- The image highlights key areas, where 68.2% of the data falls within ±1 standard deviation, 95.4% within ±2, and 99.7% within ±3, following the Empirical Rule.
- The larger the variance (σ²), the more spread out the data, making the curve flatter.
**Variance Symbol
- The symbol for variance is typically represented by the Greek letter sigma squared (**σ²) when referring to the population variance.
- For sample variance, it is often denoted by s².
Formula for Calculating Variance
The formula used for calculating the Variance is discussed in the image below:
Steps to Calculate Variance
In general, variance means population standard variance. The steps to calculate the variance of a given set of values are,
- **Step 1: Calculate the mean of the observation using the formula (Mean = Sum of Observations/Number of Observations)
- **Step 2: Calculate the squared differences of the data values from the mean. (Data Value - Mean)2
- **Step 3: Calculate the average of the squared differences of the given values, which is called the variance of the data set.
(Variance = Sum of Squared Differences / Number of Observations)
Types of Variance
We can define the variance of the given data in two types,
- Variance for Population
- Variance for Sample
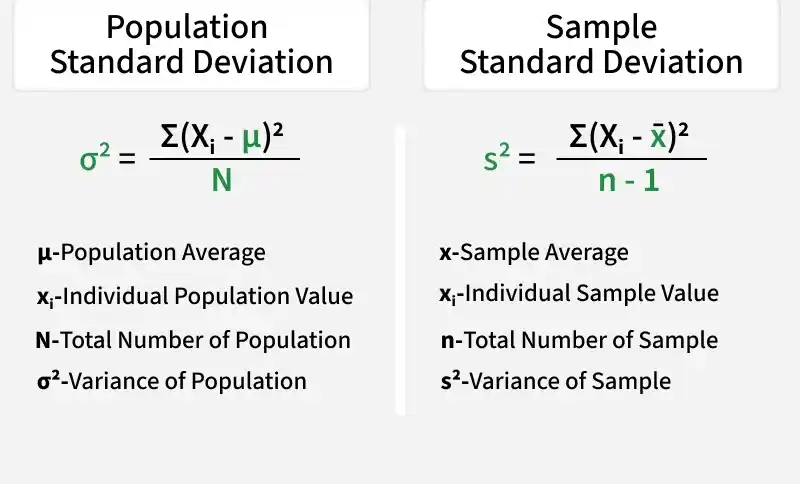
Population Variance
Population variance is used to find the spread of the given population. The population is defined as a group of people and all the people in that group are part of the population. It tells us about how the population of a group varies with respect to the mean population.
When we want to find how each data point in a given population varies or is spread out, then we use the population variance. It is used to give the squared distance of each data point from the population mean.
**Population Variance Formula
The formula for population variance is written as,
\sigma^2 = \dfrac{\sum(x_i - \bar{x})^2 }{N}
where,
- σ2 is population variance,
- x̄ is the mean of the population dataset,
- N is the total number of observations.
Population variance is mainly used when the entire population's data is available for analysis.
**Example: Find the Population variance of the data [5, 7, 9, 10, 14, 15].
**Solution:
Mean(\bar{x}) = (5 + 7 + 9 + 10 + 14 + 15) / 6 = 10
\bold{\text{Data(x)}} \bold{(x-\bar{x})^2} Value of \bold{(x-\bar{x})^2} 5 (5 - 10)2 25 7 (7 - 10)2 9 9 (9 - 10)2 1 10 (10 - 10)2 0 14 (14 - 10)2 16 15 (15 - 10)2 25 Variance = ( 25 + 9 + 1 + 0 + 16 + 25) / 6 = 76/6 = 12.67
Thus, the variance of the data is 12.67
Sample Variance
If the population data is very large, it becomes difficult to calculate the population variance of the data set. In that case, we take a sample of data from the given dataset and find the variance of that dataset, which is called sample variance.
While calculating the sample mean, we make sure to calculate the sample mean, i.e., the mean of the sample data set, not the population mean. We can define the sample variance as the mean of the squares of the differences between the sample data points and the sample mean.
**Sample Variance Formula
The formula of the Sample variance is given by,
s^2 = \frac{\sum(x_i-\bar{x})^2}{n-1}
where,
- **s 2 is sample variance,
- **x̄ is the mean of the sample dataset,
- **n is the total number of observations.
Sample variance is typically used when working with data from a sample to infer properties about
**Example: Find the Sample variance of the data {4, 6, 8, 10}
**Solution:
Mean(\bar{x}) = (4 + 6 + 8 + 10) / 4 = 7
\bold{\text{Data(x)}} \bold{(x-\bar{x})^2} Value of \bold{(x-\bar{x})^2} 4 (4 - 7)2 9 6 (6 - 7)2 1 8 (8 - 7)2 1 10 (10 - 7)2 9 Variance = (9 + 1 + 1 + 9) / (4 - 1) = 20/3
Thus, the variance of the data is 20/3
**Variance Formula for Grouped and Ungrouped Data
The variance for a data set is denoted by the symbol σ2. The formula for calculating variance differs slightly for grouped and ungrouped data.
- For ungrouped data, variance is calculated by finding the average of the squared differences between each data point and the mean.
- For grouped data, the variance takes into account the frequency of each data point or group.
Variance Formula for Grouped Data
For grouped data, the variance formula is discussed below,
- Sample Variance Formula for Grouped Data (s2) = ∑ f(mi - x̄)2/(n-1)
- Population Variance Formula for Grouped Data(σ2) = ∑ f(mi - x̄)2/N
where,
- **f is the frequency of each interval,
- **m i is the midpoint of the ith interval,
- **x̄ is the mean of the grouped data.
For grouped data mean is calculated as,
Mean = ∑ (fixi) / ∑ fi
Variance Formula for Ungrouped Data
For ungrouped data, the variance formula is discussed below,
- Sample Variance Formula for Ungrouped Data (s2) = ∑ (xi - x̄)2/(n-1)
- Population Variance Formula for Ungrouped Data (σ2) = ∑ (xi - x̄)2/N
where **x̄ is the mean of the ungrouped data.
Variance and Standard Deviation
Variance and Standard Deviation both are measures of the central tendency that is used to tell us about the extent to which the values of the data set deviate with respect to the central or the mean value of the data set.
There is a definite relationship between Variance and Standard Deviation for any given data set.
Variance = (Standard Deviation)2
Variance is defined as the square of the standard deviation, i.e., taking the square of the standard deviation for any group of data gives us the variance of that data set.
Variance is defined using the symbol **σ 2, whereas σ is used to define the Standard Deviation of the data set. Variance of the data set is expressed in squared units, while the standard deviation of the data set is expressed in a unit similar to the mean of the data set.
Variance of Binomial Distribution
Binomial Distribution is the discrete probability distribution that tells us the number of positive outcomes in a binomial experiment performed n times. The outcome of the binomial experiment is 0 or 1, i.e., either positive or negative.
In the binomial experiment of **n trials and where the probability of each trial is given by **p, then the variance of the binomial distribution is given using,
σ2 = np (1 - p) where 'np' is defined as the mean of the values of the binomial distribution.
where 'np’ is defined as the mean of the values of the binomial distribution.
Variance of Poisson Distribution
Poisson Distribution is defined as a discrete probability distribution that is used to define the probability of the 'n' number of events occurring within the 'x' period. The mean in the Poisson distribution is defined by the symbol **λ.
In the Poisson Distribution, the mean and the variance of the given data set are equal. The variance of the Poisson distribution is given using the formula,
σ2 = λ
Variance of Uniform Distribution
In a uniform distribution, the probability distribution of data is continuous. The outcome in these experiments lies in the range between a specific upper bound and a specific lower bound, and thus these distributions are also called Rectangular Distributions.
If the upper bound or the maximum bound is “**b” and the lower bound or the minimum bound is “a” then the variance of the uniform distribution is calculated using the formula,
\sigma^2 = \frac{(b - a)^2}{12}
The mean of the uniform distribution is given using the formula,
Mean = (b + a) / 2
where,
- b is the upper bound of the uniform distribution
- a is the lower bound of the uniform distribution
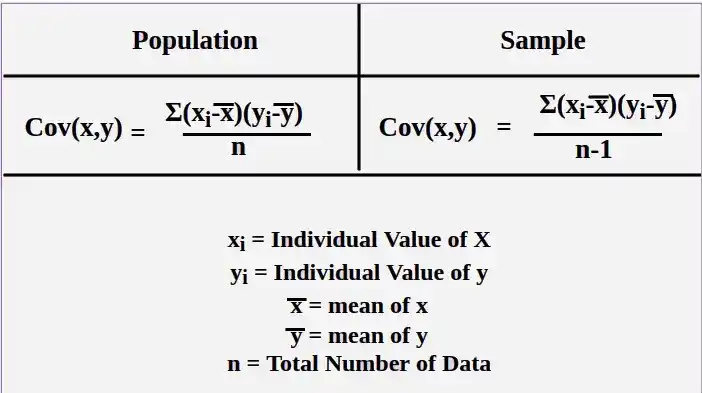
Variance and Covariance
Variance of the data set defines the volatility of all the values of the data set with respect to the mean value of the data set. Covariance tells us how the random variables are related to each other and it tells us how the change in one variable affects the change in other variables.
Covariance can be positive or negative, the positive covariance signifies that both variables are moving in the same direction with respect to the mean value whereas, negative covariance signifies that both variables are moving in opposite directions with respect to the mean value.
Variance Properties
Variance is widely used in Mathematics, Statistics, and other branches of science for a variety of purposes. Variance has various properties that are widely used for solving various problems. Some of the basic properties of the variance are,
- Variance of the data set is the non-negative quantity and the zero value of variance signifies that all the values of the data set are equal.
- A higher value of the variance tells us that all the data values of the data set are widely dispersed, i.e. they are far away form the mean value of the data set.
- A lower value of the variance tells us that all the data values of the data set are close to each other, i.e. they are very close form the mean value of the data set.
For any constant 'c'
Var(x + c) = Var(x)
where x is a random variableVar(cx) = c2․Var(x)
where x is a random variable
Also, if a and **b are constant values and **x is a random variable, then,
Var(ax + b) = a2**․Var(x)
For independent variables x1, x2, x3...,xn we know that,
Var(x1 + x2 +……+ xn) = Var(x1) + Var(x2) +……..+Var(xn)
**Solved Examples on Variance Formula
**Example 1: Calculate the variance of the sample data: 7, 11, 15, 19, 24.
We have the data, 7, 11, 15, 19, 24
Find mean of the data.
x̄ = (7 + 11 + 15 + 19 + 24)/5
= 76/5
= 15.2Using the formula for variance we get,
s2 = ∑ (xi - x̄)2/(n - 1)
= (67.24 + 17.64 + 0.04 + 14.44 + 77.44)/(5 - 1)
= 176.8/4
= 44.2
**Example 2: Calculate the number of observations if the variance of the dataset is 12 and the sum of squared differences of data from the mean is 156.
We have,
(xi - x̄)2 = 156
σ2 = 12Using the formula for variance we get,
σ2 = ∑ (xi - x̄)2/n
12 = 156/n
12n = 156
n = 156/ 12
n = 13
**Example 3: Calculate the variance for the given data
| xi | fi |
|---|---|
| 10 | 1 |
| 4 | 3 |
| 6 | 5 |
| 8 | 1 |
xi fi fixi (xi - x̄) (xi - x̄)2 fi(xi - x̄)2 10 1 10 4 16 16 4 3 12 -2 4 12 6 5 30 0 0 0 8 1 8 2 4 4 Mean (x̄) = ∑(fi xi)/∑(fi)
= (10×1 + 4×3 + 6×5 + 8×1)/(1+3+5+1)
= 60/10 = 6n = ∑(fi) = 1+3+5+1 = 10
Now,
**σ 2 = (∑ i n f i (x i - x̄) 2 /n)
**= (16 + 12 + 0 +4)/10
= 3.2Variance(σ2) = 3.2
**Example 4: Find the variance of the following data table
| Class | Frequency |
|---|---|
| 0-10 | 3 |
| 10-20 | 6 |
| 20-30 | 4 |
| 30-40 | 2 |
| 40-50 | 1 |
Class Xi fi f×Xi Xi - μ (Xi - μ)2 f×(Xi - μ)2 0-10 5 3 15 -15 225 675 10-20 15 6 90 -5 25 150 20-30 25 4 100 5 25 100 30-40 35 2 70 15 225 450 40-50 45 1 45 25 625 625 **Total **16 **320 **2000 Mean (μ) = ∑(fi xi)/∑(fi)
= 320/16 = 20**σ 2 = (∑ i n f i (x i - μ) 2 /n)
= [(2000)/(16)]
= (125)The variance of given data set is 125.