Standard Deviation (original) (raw)
Last Updated : 26 Dec, 2025
Standard Deviation is a statistical measure that describes how much variation or dispersion there is in a set of data points. It helps us understand how spread out the values in a dataset are compared to the mean (average).
A higher standard deviation means the data points are more spread out, while a lower standard deviation means they are closer to the mean. It is classified as:
- **Low standard deviation: The data points are close to the mean, meaning the values are relatively consistent.
- **High standard deviation: The data points are spread out over a wider range, meaning there's more variability in the data.
**Example:
- If you have test scores like 90, 91, 92, 93, the standard deviation is small because all the scores are close to each other.
- If you have test scores like 60, 80, 90, 100, 120, the standard deviation is large because the scores are spread out over a wide range.
Mathematical Definition
In mathematical terms, the standard deviation is the square root of the **variance. Variance is the average of the squared differences from the mean.
- Standard Deviation is defined as the degree of dispersion of the data points from the mean value of the data points.
\text{Mean Deviation} =\frac{1}{n} \sum_{i=1}^{n} (x_i - \bar{x})^2
- Standard deviation is a measure used in statistics to understand how the data points in a set are spread out from the mean value.
- It indicates the extent of the data's variation and shows how far individual data points deviate from the average.
Standard Deviation Formulas
The formula for the standard deviation depends on whether you're working with a sample or an entire population.
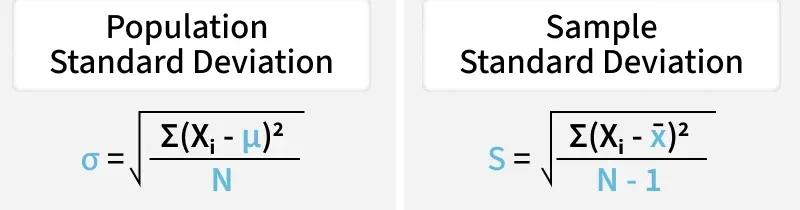
**For Sample Data
\bold{s = \sqrt{\frac{\sum_{i=1}^n (x_i - x̄)^2}{n-1}}}
where,
- **s is Sample Standard Deviation
- **x i is the ith observation
- **x̄ is the Sample Mean
- **N is the Number of Observations
- **∑ = sum over all the values
For Population Data
\bold{\sigma = \sqrt{\frac{\sum_{i=1}^N (x_i - \mu)^2}{N}}}
where,
- **σ is Population Standard Deviation
- **x i is the ith Observation
- **μ is Population Mean
- **N is the Number of Observations
- **∑ = Sum over all the values
It is evident that both formulas look the same and have only slide changes in their denominator.
- For a population, the denominator is **N.
- For a sample, the denominator is n - 1.
Historically, the sample standard deviation was first written with **n in the denominator, but the results tended to underestimate the true variability of the population.
To correct this bias, the denominator was changed from **n to **n − 1. This adjustment is known as **Bessel’s correction, and it gives an unbiased estimate of the population variance when working with samples.
Steps to Calculate Standard Deviation
Generally, when we talk about standard deviation, we talk about **population standard deviation. The steps to calculate the standard deviation of a given set of values are as follows,
**Step 1: Calculate mean of observation using the data
(Mean = Sum of Observations/Number of Observations)**Step 2: Calculate squared differences of data values from the mean.
(Data Value - Mean)2**Step 3: Calculate average of squared differences
(Variance = Sum of Squared Differences / Number of Observations)**Step 4: Calculate square root of variance this gives the Standard Deviation
(Standard Deviation = √Variance)
Variance
Variance is a statistical measure that tells us how spread out the values in a data set are from the mean (average).
It is the average of the squared differences from the mean.
Variance shows how much the numbers in your data vary from the average value.
- If the variance is small, the numbers are close to the mean.
- If the variance is large, the numbers are more spread out.
Variance Formula
The formula to calculate the variance of a dataset is as follows:
**Variance (σ 2 ) = Σ [(x - μ) 2 ] / N
Where:
- **Σ denotes Summation (adding up)
- **x represents Each Individual Data Point
- **μ is the Mean (Average) of the Dataset
- **N is the Total Number of Data Points
- **∑ = sum over all the values
Variance vs Standard Deviation
The key difference between variance and standard deviation is given below:
| Variance | Deviation (Standard Deviation) |
|---|---|
| The measure of spread in a dataset. | Measure of average distance from the mean. |
| Average of squared differences from the mean. | The square root of the variance. |
| σ^2 (sigma squared) | σ (sigma) |
| Indicates the average squared deviation of data points from the mean. | Indicates the average distance of data points from the mean. |
| Harder to interpret directly (due to squared units) | Easier to interpret; shows how spread out the data is |
Standard Deviation of Ungrouped Data
For ungrouped data, the standard deviation can be calculated using three methods:
- Actual Mean Method
- Assumed Mean Method
- Step Deviation Method
Standard Deviation by Actual Mean Method
Standard Deviation by the actual mean method uses the basic mean formula to calculate the mean of the given data,and using this mean value, we find the standard deviation of the given data values.
We calculate the mean in this method with the formula:
**μ = (Sum of Observations)/(Number of Observations)
Standard deviation formula for the Actual mean method
**σ = √(∑ i n (x i - x̄) 2 /n)
**Example: Find the Standard Deviation of the data set, X = {2, 3, 4, 5, 6}
Given,
- n = 5
- xi = {2, 3, 4, 5, 6}
We know,
Mean(μ) = (Sum of Observations)/(Number of Observations)
⇒ μ = (2 + 3 + 4 + 5 + 6)/ 5
⇒ μ = 4using standard deviation formula
σ2 = ∑in (xi - x̄)2/n
⇒ σ2 = 1/n[(2 - 4)2 + (3 - 4)2 + (4 - 4)2 + (5 - 4)2 + (6 - 4)2]
⇒ σ2 = 10/5 = 2**Thus, σ = √(2) = 1.414
Standard Deviation by Assumed Mean Method
For very large values of x, finding the mean of the grouped data is a tedious task; therefore, we use an assumed mean method where we assume an arbitrary value (A) as the mean value and then calculate the standard deviation using the normal method. Suppose for the group of n data values ( x1, x2, x3, ..., xn), the assumed mean is A, then the deviation is,
**d i = x i - A
Where,
- **x i= data values
- A = assumed mean
Standard Deviation formula for the assumed mean method
**σ = √(∑ i n (d i ) 2 /n)
Where,
- '**n' = Total Number of Data Values
- di = xi - A
Standard Deviation by Step Deviation Method
We can also calculate the standard deviation of the grouped data using the step deviation method. As in the above method, in this method also, we choose some arbitrary data value as the assumed mean (say A). Then we calculate the deviations of all data values (x1, x2, x3, ..., xn), di = xi - A
In the next step, we calculate the Step Deviations (d') using
**d' = d/i
where '**i is a Common Factor of all values
Standard Deviation Formula for Step Deviation Method
**σ = √[(∑(d i 2 /n) - (∑d i n) 2 ] × i
where,
- '**n' = Total Number of Data Values
- di = xi - A
Standard Deviation of Discrete Grouped Data
In grouped data, first, we made a frequency table, and then any further calculation was made. For discrete grouped data, the standard deviation can also be calculated using three methods:
- Actual Mean Method
- Assumed Mean Method
- Step Deviation Method
Formula Based on Discrete Frequency Distribution
For a given data set, if it has n values (x1, x2, x3, ..., xn) and the frequency corresponding to them is (f1, f2, f3, ..., fn), then its standard deviation is calculated using the formula,
**σ = √(∑ i n f i (x i - x̄) 2 /n)
where,
- **n is Total Frequency (n = f1 + f2 + f3 +...+ fn )
- **x̄ is the Mean of the Data
- **x i Value of data point
- **f i frequency of data points
**Example: Calculate the standard deviation for the given data
| xi | fi |
|---|---|
| 10 | 1 |
| 4 | 3 |
| 6 | 5 |
| 8 | 1 |
**Solution:
Mean (x̄) = ∑(fi xi)/∑(fi)
⇒ Mean (μ) = (10×1 + 4×3 + 6×5 + 8×1)/(1 + 3 + 5 + 1)
⇒ Mean (μ) = 60/10 = 6n = ∑(fi) = 1 + 3 + 5 + 1 = 10
| xi | fi | (xi - x̄) | (xi - x̄)2 | fi(xi - x̄)2 |
|---|---|---|---|---|
| 10 | 1 | 4 | 16 | 16 |
| 4 | 3 | -2 | 4 | 12 |
| 6 | 5 | 0 | 0 | 0 |
| 8 | 1 | 2 | 4 | 4 |
∑fi (xi − xˉ)2 = 16 + 12 + 0 + 4 = 32
Now, using standard deviation formula
**σ = √(∑ i n f i (x i - x̄) 2 /n)
⇒ σ = √[(32)/10]
⇒ σ = √(3.2) ≈1.7888Standard Derivation(σ) = 1.7888
Standard Deviation of Discrete Data by Assumed Mean Method
In grouped data, if the values in the given data set are very large, then we assume a random value (say A) as the mean of the data. Then, the deviation of each value from the assumed mean is calculated as,
**d i = x i - A
**d i **= Deviation of data point from assumed mean
Standard deviation formula for the assumed mean method
**σ = √[(∑(f i d i ) 2 /n) - (∑f i d i /n) 2 ]
where,
- '**f' is the Frequency of Data Value x
- **d i **= Deviation of data point from assumed mean
- '**n' is Total Frequency [n = ∑(f i )]
Standard Deviation of Discrete Data by Step Deviation Method
We can also use the step deviation method to calculate the standard deviation of the discrete grouped data. As in the above method, in this method also, we choose some arbitrary data value as the assumed mean (say A). Then we calculate the deviations of all data values (x1, x2, x3, ..., xn), di = xi - A
In the next step,we calculate the Step Deviations (d') using
**d' = d/i
where '**C' is the Common Factor of all '**d' values
Standard deviation formula for the Step Deviation Method
**σ = C \sqrt{\frac{\sum f_i d_i^2}{N} - \left(\frac{\sum f_i d_i}{N}\right)^2}
Where,
- σ = Standard Deviation
- C = Common Factor of all 'd values
- ∑f_id_i^2 = Sum total of the squared step deviations multiplied by frequencies
- ∑f_id_i = Sum total of step deviations multiplied by frequencies
- N = Total Number of Data Values
Standard Deviation of Continuous Grouped Data
For the continuous grouped data, we can easily calculate the standard deviation using the Discrete data formulas by replacing each class with its midpoint (as xi) and then normally calculating the formulas.
The calculation of each class is calculated using the formula:
**x i (Midpoint) = (Upper Bound + Lower Bound)/2
Standard Deviation Formula for Grouped Data:
****s =**\sqrt{\frac{\sum f_i (x_i - \bar{x})^2}{\sum f_i}}
Where:
- x_i = midpoint of each class interval
- f_i = frequency of each class interval
- \bar{x}= mean of the grouped data
- s = standard deviation
**For example: Calculate the standard deviation of continuous grouped data as given in the table.
| Class | 0-10 | 10-20 | 20-30 | 30-40 |
|---|---|---|---|---|
| Frequency(fi) | 2 | 4 | 2 | 2 |
**Solution:
| Class | 5-15 | 15-25 | 25-35 | 35-45 |
|---|---|---|---|---|
| xi | 10 | 20 | 30 | 40 |
| Frequency(fi) | 2 | 4 | 2 | 2 |
Mean (x̄) = ∑(fi xi)/∑(fi)
⇒ Mean (μ) = (10×2 + 20×4 + 30×2 + 40×2)/(2+4+2+2)
⇒ Mean (μ) = 240/10 = 24
n = ∑(fi) = 2+4+2+2 = 10
| xi | fi | fixi | (xi - x̄) | (xi - x̄)2 | fi(xi - x̄)2 |
|---|---|---|---|---|---|
| 10 | 2 | 20 | 14 | 196 | 392 |
| 20 | 4 | 80 | -4 | 16 | 64 |
| 30 | 2 | 60 | 6 | 36 | 72 |
| 40 | 2 | 80 | 16 | 256 | 512 |
Now **using standard deviation formula:
**σ = √(∑ i n f i (x i - x̄) 2 /n)
⇒ σ =√[(392 + 64 + 72 +512)/10]
⇒ σ = √(104) = 10.198Standard Derivation(σ) = 10.198
Standard Deviation of Probability Distribution
In probability of all the possible outcomes are generally equal, and we take many trials to find the experimental probability of the given experiment.
- For a normal distribution, the expected mean is zero and the Standard Deviation is 1.
Standard Deviation Formula Binomial Distribution
For a binomial distribution, the standard deviation is given by the formula,
**σ = √(npq)
where,
- **n is the Number of Trials
- **P is the Probability of Success of a Trial
- **q is Probability of Failure of Trial (q = 1 - p)
Standard Deviation Formula Poisson Distribution
For a Poisson distribution, the standard deviation is given by
**σ = √λt
where,
- **λ is the Average Number of Successes
- **t is given a time interval
Standard Deviation of Random Variables
Random variables are the numerical values that denote the possible outcomes of the random experiment in the sample space. Calculating the standard deviation of the random variable tells us about the probability distribution of the random variable and the degree of the difference from the expected value.
We use X, Y, and Z as functions to represent the random variables. The probability of the random variable is denoted as P(X), and the expected mean value is denoted by the μ symbol.
Then the Standard Deviation formula for the standard deviation of a probability distribution is,
σ = \sqrt{(∑ (x_i - μ)^2 × P(x_i))}
where:
- **x i **= data points
- **p(x i ) = probability of xi
- **μ = Expected mean Value
**Solved Examples on Standard Deviation
**Example 1: Find the Standard Deviation of the following data,
| xi | 5 | 12 | 15 |
|---|---|---|---|
| fi | 2 | 4 | 3 |
**Solution:
First, make the table as follows, so we can calculate the further values easily.
Xi fi Xi×fi Xi-μ (Xi-μ)2 f×(Xi-μ)2 5 2 10 -6.375 40.64 81.28 12 3 36 0.625 0.39 1.17 15 3 45 3.625 13.14 39.42 **Total 8 91 121.87 Mean (μ) = ∑(fi xi)/∑(fi)
⇒ Mean (μ) = 91/8 = 11.375
**using standard deviation formula
σ = √(∑in fi(xi - μ)2/n)
⇒ σ = √[(121.87)/(8)]
⇒ σ = √(15.234)
⇒ σ = 3.90Standard Derivation(σ) = 3.90
**Example 2: Find the Standard Deviation of the following data table.
| Class | Frequency |
|---|---|
| 0-10 | 3 |
| 10-20 | 6 |
| 20-30 | 4 |
| 30-40 | 2 |
| 40-50 | 1 |
**Solution:
Class Xi fi f×Xi Xi - μ (Xi - μ)2 f×(Xi - μ)2 0-10 5 3 15 -15 225 675 10-20 15 6 90 -5 25 150 20-30 25 4 100 5 25 100 30-40 35 2 70 15 225 450 40-50 45 1 45 25 625 625 **Total **16 **320 **2000 Mean (μ) = ∑(fi xi)/∑(fi)
⇒ Mean (μ) = 320/16 = 20
**now, by using standard deviation formula
σ = √(∑in fi(xi - μ)2/n)
⇒ σ = √[(2000)/(16)]
⇒ σ = √(125)
⇒ σ = 11.18Standard Derivation(σ) = 11.18
Standard Deviation Formula in Excel
- Use Excel's built-in functions
STDEV.Pfor the entire population orSTDEV.Sfor a sample. - **Step-by-Step Guide: Enter your data set in a single column, then type
=STDEV.S(A1:A10)(replace A1:A10 with your data range.) in a new cell to get the standard deviation for a sample. - **Visual Aids: Utilize Excel's chart tools to visually represent data variability alongside standard deviation.
**Example: Suppose you have the following numbers in cells **A1 to A5:
**Solution:
- For population SD:
=STDEV.P(A1:A5) - For sample SD:
=STDEV.S(A1:A5)
**Read in Detail: **Standard Deviation in Excel: How to Calculate, Formulas