Data Drift in Machine Learning (original) (raw)
Last Updated : 23 Jul, 2025
**Data drift is a situation where the statistical properties of the input data to a machine learning model change over time. When data drift occurs, the relationships between the features and the target variable are no longer valid. This can lead to poor model performance, inaccurate predictions and even failures.
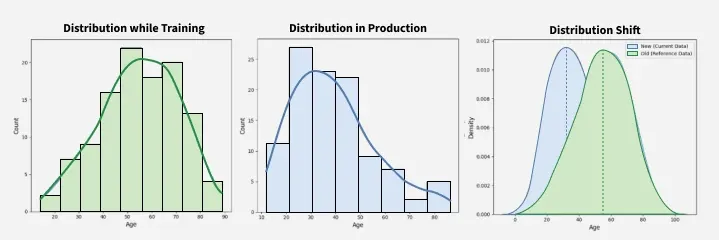
Graphs showing Data Drift
**Why do models drift
Machine learning models can experience drift over time for several reasons. One common cause is when the data used to train the model becomes outdated or no longer reflects current conditions. Another reason for model drift is that some models are not designed to adapt to changes in the data. While certain machine learning models are better equipped to handle these changes, no model is entirely immune to drift.
For example , Suppose a machine learning model designed to predict a company's stock price using historical data. If the model is trained on data from a stable market, it may perform well initially. However, if the market becomes more volatile, the model may struggle to make accurate predictions because the statistical characteristics of the data have changed.
**Types of Data Drift
1. Concept Drift
Concept Drift refers to the change in the statistical relationship between input features (**X) and the target variable (**Y) over time. This implies that the patterns learned by a machine learning model at one point may no longer hold true in the future, which affects the model's performance and generalization ability.
Concept drift can be broadly categorized into four types:
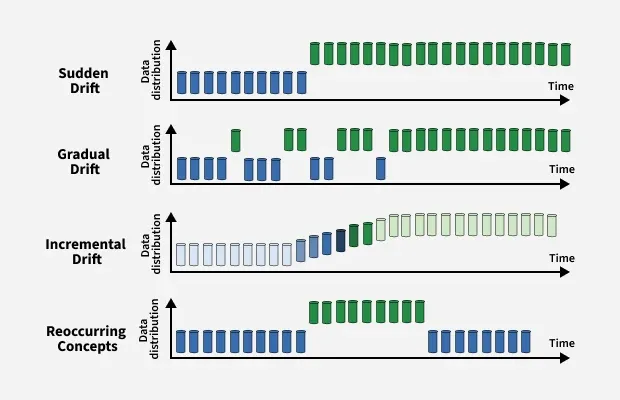
Visualizing various concept drifts
- **Sudden Drift : A rapid change in data distribution, where the new concept entirely replaces the old one. This often leads to an immediate drop in model accuracy if not handled properly.
- **Gradual Drift : The data distribution changes slowly over time, allowing old and new concepts to coexist for a while. The model may still perform reasonably well during this transition, but performance degrades if adaptation is delayed.
- **Incremental Drift : The shift in concept occurs through a sequence of small, incremental changes. Each step introduces a slight deviation, eventually leading to a completely different concept. This type of drift can be subtle and difficult to detect.
- **Recurring or Seasonal Drift : Previously observed concepts reappear after a period. For example, seasonal patterns in retail sales or cyclic user behavior may cause certain data distributions to reoccur, requiring models to retain memory of past states.
2. Covariate Drift
Covariate Drift occurs when the distribution of the input features changes over time, while the conditional relationship between the inputs (**X) and the target output (**Y) remains unchanged. In simple words, the way inputs are distributed shifts, but the underlying mapping from **X to **Y stays consistent. This can still impact model performance if the model is exposed to input patterns it has not encountered during training.
Differences between Concept Drift and Covariate Drift
| **Aspect | **Concept Drift | **Covariate Drift |
|---|---|---|
| **Change in | The relationship between input (**X) and output (**Y) | The distribution of input features (**X) |
| **Output Behavior | For the same input, the expected output may change over time | Output behavior remains the same, only input patterns change |
| **Model Impact | Directly affects model accuracy due to outdated learned relationships | May affect model generalization if unseen input patterns dominate |
| **Adaptation Strategy | Retrain the model using new data reflecting the changed relationship | Ensure training data covers a representative input distribution |
Algorithms for Detecting Data Drift
1. Kolmogorov-Smirnov (K-S) Test
The Kolmogorov-Smirnov (K-S) test is a statistical test used to determine whether two datasets originate from the same distribution. It does not assume any specific distribution shape which makes it suitable for a wide range of applications. It is often applied in situations where we want to test whether a sample of data is drawn from a specific population or to compare two different samples to assess whether they come from the same distribution.
**Mechanism :
- The test works by comparing the **cumulative distribution functions (CDFs) of two datasets. It looks at how the values in each dataset are spread out and adds them up step by step.
- The default assumption of the test is that both datasets come from the same distribution. If this assumption is rejected, it means there is likely a difference in the distributions indicating data drift.
2. Population Stability Index (PSI)
The Population Stability Index (PSI) is a statistical measure used to assess how much the distribution of a variable has changed between two datasets. It is primarily used for tracking changes in categorical or binned continuous variables over time. Though it was originally developed for monitoring credit scorecard stability in the financial domain, PSI is now widely used for evaluating shifts in distributions of both features and target variables in machine learning pipelines.
**Mechanism :
- The PSI compares the proportion of observations from each bin of the variable's distribution. Checked in both the training dataset and the incoming or test dataset.
- The difference in these proportions across all bins is aggregated into a single PSI score.
- **PSI < 0.1 : No significant change in the distribution.
- **0.1 ≤ PSI < 0.25 : Moderate change, may warrant closer monitoring.
- **PSI ≥ 0.25 : Significant drift, model retraining or recalibration likely needed.
3. Page-Hinkley Method
The Page-Hinkley method is a sequential technique to detect changes in the mean of a data stream over time. This method is commonly used for monitoring time series data or streaming data where early detection of change is essential. It is frequently applied to monitor model performance and detect shifts that may not be obvious at first glance.
**Mechanism :
- A threshold value and a decision function are defined. The threshold determines how large a change in the mean must be for consideration. The decision function evaluates a statistically meaningful shift has occurred at each time step.
- Then we compute the cumulative difference between observed values and their mean.
- Monitor the cumulative difference to detect deviations that exceed the defined threshold.
Implementing Data Drift detection
1. Import Libraries
We will be using Numpy, Pandas, Matplotlib, Seaborn and ks_2samp for 2 sample K-S test.
Python `
import numpy as np import pandas as pd from scipy.stats import ks_2samp import matplotlib.pyplot as plt import seaborn as sns
`
2. Synthetic Data Generation
Here we generate synthetic data to visualize data drift in further steps. Baseline data has mean 0, while new data has mean = 2. This simulates incoming/test data with drift (distribution has shifted right).
Python `
np.random.seed(42)
baseline_data = np.random.normal(loc=0.0, scale=1.0, size=1000)
new_data = np.random.normal(loc=2.0, scale=1.0, size=1000)
`
3. Visualization Distribution
The sns.kdeplot() function in seaborn and is used to plot the Kernel Density Estimate (KDE) of a continuous variable. It's a smoothed version of a histogram.
Python `
plt.figure(figsize=(10, 5)) sns.kdeplot(baseline_data, label='Baseline Data (N(0,1))', linewidth=2) sns.kdeplot(new_data, label='New Data (N(2,1))', linewidth=2) plt.title("Baseline vs. New Data Distribution") plt.xlabel("Feature Value") plt.ylabel("Density") plt.legend() plt.tight_layout() plt.show()
`
**Output:
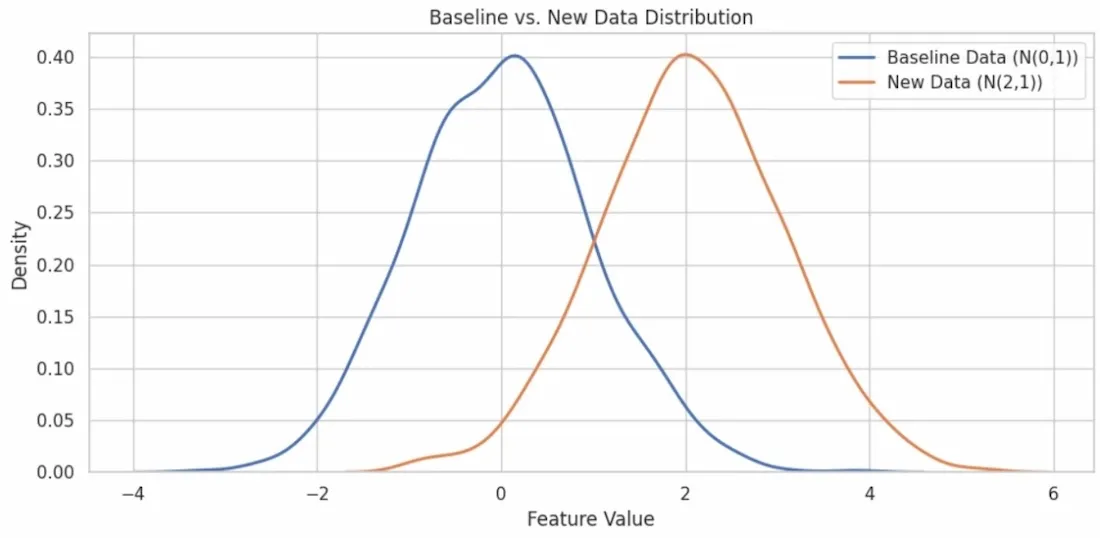
Visualizing Data drift
4. Kolmogorov-Smirnov Test
Python `
ks_statistic, ks_pvalue = ks_2samp(baseline_data, new_data)
print("Kolmogorov-Smirnov Test Result:") print(f"Statistic: {ks_statistic:.4f}") print(f"P-value : {ks_pvalue:.4f}")
if ks_pvalue < 0.05: print("Drift Detected (p < 0.05)") else: print("No Significant Drift Detected")
`
**Output :
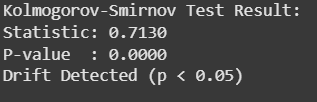
Result showcasing data drift
- **Statistic : maximum difference between the two CDFs
- **P-value : Probability that the difference happened by chance under the default assumption.
P-value < 0.05, then we can say significant drift is detected.
Managing Data Drift
Once data drift is detected, it is important to take action to ensure the model remains accurate and reliable. There are several methods to handling data drift effectively :
- **Retraining the Model : It allows the model to learn new patterns and relationships that may have evolved over time. This strategy is best used when enough labeled data is available and computational resources allow for full retraining without major constraints.
- **Updating the Model with New Data : When full retraining is impractical, models can be updated incrementally using new data. Transfer learning allows tuning of pre-trained models with recent data. This approach is ideal for real-time systems or systems where resources are limited.
- **Feature Engineering Adjustments: Data drift can reduce the relevance of certain features, which makes feature engineering a critical adjustment strategy. New features that better capture current trends should be introduced and irrelevant ones should be removed. This keeps the model’s input aligned with the evolving data landscape****.**
- **Ensemble Learning: Using an ensemble of models trained on different time periods helps neutralize the effects of data drift. Methods like bagging, boosting or stacking combine multiple predictions. This enhances model stability even when individual models perform poorly due to data drift.