KolmogorovSmirnov Test (KS Test) (original) (raw)
Kolmogorov-Smirnov Test (KS Test)
Last Updated : 14 Feb, 2026
The Kolmogorov–Smirnov (KS) test is a non-parametric method for comparing probability distributions and checking if two samples differ significantly. It is widely used in statistics, data analysis and quality control because it does not assume any specific distribution form.
- Compares one-dimensional distributions without assuming a specific form.
- Often used to test random number uniformity or model fit.
- Provides a statistic and p-value to determine if samples differ significantly.
Cumulative distribution function (CDF) of the Kolmogorov distribution is defined by:
F(x) = 1 - 2 \sum_{k = 1}^{\infty} (-1)^{k-1} e^{-2k^2 x^2}
where
- n is the sample size.
- x is the normalized Kolmogorov-Smirnov statistic.
- k is the index of summation in the series
How does Kolmogorov-Smirnov Test work
Below are the steps for how the Kolmogorov-Smirnov test works:
1. Hypotheses Formulation
- **Null Hypothesis : The sample follows a specified distribution.
- **Alternative Hypothesis****:** The sample does not follow the specified distribution.
2. Selection of a Reference Distribution
A theoretical distribution (e.g., normal, exponential) is decided against which you want to test the sample distribution. This distribution is usually based on theoretical expectations or prior knowledge.
3. Calculation of the Test Statistic (D)
- In a one-sample KS test, the statistic D is the maximum vertical difference between the sample’s empirical distribution function (EDF) and the reference CDF.
- For a two-sample Kolmogorov-Smirnov test, the test statistic compares the EDFs of two independent samples.
4. Determination of Critical Value or P-value
- The test statistic (D) is compared to a critical value from the Kolmogorov-Smirnov distribution table or, more commonly, a p-value is calculated.
- If the p-value is less than the significance level (commonly 0.05), the null hypothesis is rejected, suggesting that the sample distribution does not match the specified distribution.
5. Interpretation of Results
If the null hypothesis is rejected, it indicates that there is evidence to suggest that the sample does not follow the specified distribution. The alternative hypothesis, suggesting a difference, is accepted.
One Sample Kolmogorov-Smirnov Test
The one-sample Kolmogorov-Smirnov (KS) test is used to determine whether a sample comes from a specific distribution. It is particularly useful when the assumption of normality is in question or when dealing with small sample sizes. The test statistic, denoted as D_n, measures the maximum difference between the two cumulative distribution functions.
Empirical Distribution Function
The empirical distribution function at the value x represents the proportion of data points that are less than or equal to x in the sample. The function can be defined as:
Fn(x) = \frac{1}{n} \sum_{i=1}^n \mathbb{1}_{(-\infty, x]}(X_i)
where
- n is the number of observations in the sample
- X_i represents the individual observations
- \mathbb{1}_{(-\infty, x]}(X_i) is an indicator function that is 1 if Xi ≤ x and 0 otherwise i.e if the condition is satisfied for the each observation X_i, it is simply 1, otherwise 0.
Kolmogorov–Smirnov Statistic
The Kolmogorov–Smirnov statistic for a given cumulative distribution function F(x) is defined as:
D_n = sup_x | F(x) - Fn(x) |
where
- sup stands for supremum, which means the largest value over all possible values of x.
- F(x) is the theoretical cumulative distribution function.
- Fn(x) is the empirical cumulative distribution function of the sample (calculated as described above).
Implementation
Here we generates 100 random normal samples, performs the KS test to check normality and compares results with critical values, while plotting the sample histogram against the reference PDF.
Python `
import numpy as np from scipy.stats import norm, kstest import matplotlib.pyplot as plt
np.random.seed(42) sample_size = 100 mean, std_dev = 0, 1 sample = np.random.normal(mean, std_dev, sample_size)
ks_statistic, p_value = kstest(sample, 'norm', args=(mean, std_dev))
alpha = 0.05
critical_value = 1.36 / np.sqrt(sample_size) print(f"KS Statistic: {ks_statistic:.4f}") print(f"P-value: {p_value:.4f}") print(f"Critical Value (alpha={alpha}): {critical_value:.4f}")
if ks_statistic > critical_value or p_value < alpha: print("Reject the null hypothesis: The sample does NOT follow the specified distribution.") else: print("Fail to reject the null hypothesis: The sample follows the specified distribution.")
x = np.linspace(min(sample), max(sample), 100) plt.figure(figsize=(8, 5)) plt.hist(sample, bins=20, density=True, alpha=0.6, label="Sample Distribution") plt.plot(x, norm.pdf(x, mean, std_dev), 'r', label="Reference Normal PDF") plt.title("One-Sample Kolmogorov-Smirnov Test") plt.xlabel("Value") plt.ylabel("Density") plt.legend() plt.show()
`
**Output:
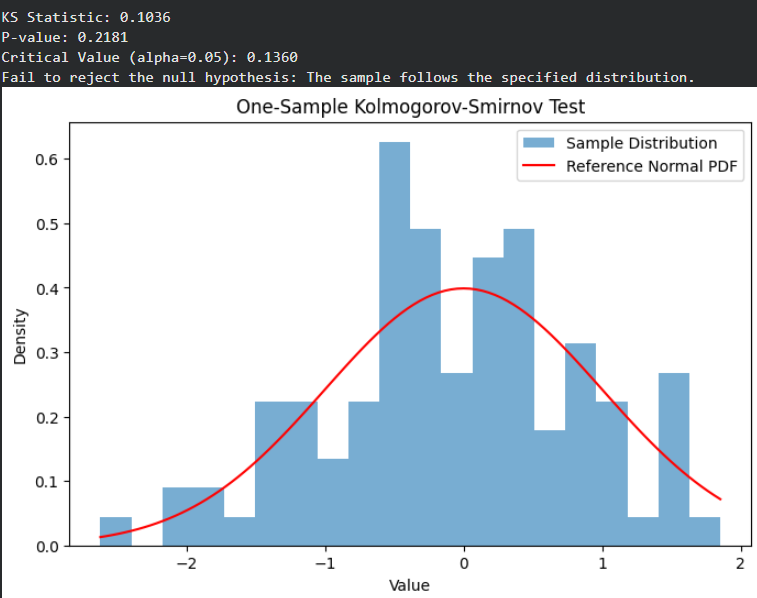
One Sample Kolmogorov smirnov Test
The small KS statistic and p-value greater than 0.05 indicate the sample’s EDF closely matches the normal CDF, so we fail to reject the null hypothesis.
Two-Sample Kolmogorov–Smirnov Test
The two-sample KS test compares two independent samples by measuring the maximum difference between their empirical distribution functions to assess if they come from the same distribution.
Empirical Distribution Function (EDF)
The empirical distribution function at the value ( x ) in each sample represents the proportion of observations less than or equal to ( x ). Mathematically, the EDFs for the two samples are given by:
For Group 1:
F_1(x) = \frac{1}{n_1} \sum_{i=1}^{n_1} \mathbb{1}{(-\infty, x]}(X{1i})
For Group 2:
F_2(x) = \frac{1}{n_2} \sum_{j=1}^{n_2} \mathbb{1}{(-\infty, x]}(X{2j})
Where
- n_1 and n_2 are the sample sizes for the two groups
- X_{1i} and X_{2j} represent individual observations in the respective samples,
- \mathbb{1}{(-\infty, x]}(X_{1i}) and \mathbb{1}{(-\infty, x]}(X_{2j}) are the indicator functions.
Kolmogorov–Smirnov Statistic
D_{n,m} = \sup_{x} |F_{1,n}(x) - F_{2,m}(x)|
where,
- sup denotes the supremum, the largest value over all x values.
- F_{1}(x), F_{2}(x) are the empirical cumulative distribution functions (ECDFs).
Implementation
The two-sample KS test in Python compares whether two independent samples come from the same distribution by calculating a statistic and p-value, with rejection of the null hypothesis if p < 0.05.
Python `
import numpy as np import matplotlib.pyplot as plt from scipy.stats import ks_2samp
np.random.seed(42) sample1 = np.random.normal(loc=0.0, scale=1.0, size=100) sample2 = np.random.normal(loc=0.5, scale=1.5, size=120)
ks_statistic, p_value = ks_2samp(sample1, sample2, alternative='two-sided', mode='auto')
alpha = 0.05
print(f"KS Statistic: {ks_statistic:.4f}") print(f"P-value: {p_value:.4f}")
if p_value < alpha: print("Reject the null hypothesis: The two samples come from different distributions.") else: print("Fail to reject the null hypothesis: No significant distributional difference detected.")
plt.figure(figsize=(8, 5)) plt.hist(sample1, bins=25, density=True, alpha=0.6, label="Sample 1") plt.hist(sample2, bins=25, density=True, alpha=0.6, label="Sample 2") plt.title("Two-Sample Kolmogorov-Smirnov Test") plt.xlabel("Value") plt.ylabel("Density") plt.legend() plt.show()
`
**Output:
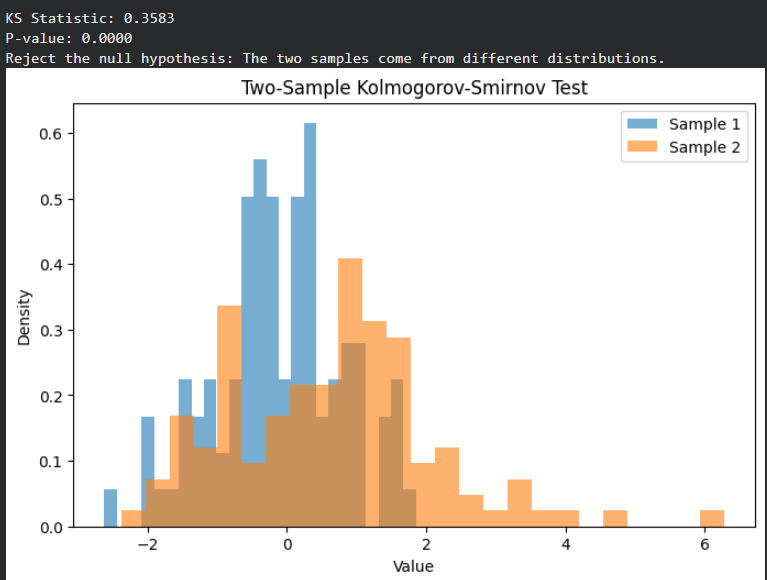
Two-Sample Kolmogorov-Smirnov Test
A high KS statistic and very small p-value indicate a large difference between the samples’ distributions, leading to rejection of the null hypothesis.
One-Sample KS Test vs Two-Sample KS Test
Here we compare One sample and Two sample KS test
| Features | One-Sample KS Test | Two-Sample KS Test |
|---|---|---|
| Goal | Checks if a single sample fits a theoretical distribution | Checks if two samples come from the same distribution |
| Comparison Metric | Compares the sample’s EDF with the theoretical CDF | Compares the EDF of one sample with the EDF of the other sample |
| Null Hypothesis | Sample follows the specified distribution | Both samples come from the same distribution |
| Test Statistic | Maximum vertical deviation between EDF and CDF | Maximum difference between the two EDFs |
Multidimensional Kolmogorov-Smirnov Testing
The KS test can be extended to multidimensional data to compare whether two samples follow the same distribution across all dimensions.
- Adapts the one-dimensional KS test to evaluate differences in multiple dimensions simultaneously.
- Measures the maximum difference in cumulative distribution functions along each dimension.
- Useful in multivariate statistics, machine learning and pattern recognition for comparing multidimensional datasets.
When use Kolmogorov-Smirnov Test
- Use the KS test to check if two samples follow the same distribution or have similar distribution shapes.
- Apply it to compare cumulative probability distributions and quantify differences between datasets.
- Higher maximum differences indicate greater dissimilarity in distribution shapes.
- Useful for evaluating probability distributions and the overall shape of data distributions.
- Can be applied in both parametric and non-parametric hypothesis testing scenarios.
**Applications
- Checks if a dataset follows a specific distribution for model fitting and prediction.
- Compares two datasets to determine if they come from the same distribution.
- Validates assumptions about dataset distributions for correct statistical analyses.
- Serves as a non-parametric alternative when parametric tests are not applicable.
**Limitations
- May have limited power with small samples and can detect trivial differences in large samples.
- Assumes observations are independent, making it unsuitable for dependent data.
- Applicable only to continuous data, not discrete or categorical data without adjustments.
- Focuses on overall distribution differences and may miss specific distributional properties.
- Multiple tests increase the risk of Type I errors in hypothesis testing.