Multivariate Regression (original) (raw)
Last Updated : 24 Mar, 2026
Multivariate Regression is a technique used when we need to predict more than one output variable at the same time. Instead of building separate models for each target, a single model learns how input features are connected to multiple outputs together. This is especially useful when the outputs are related to each other and may influence one another.
- Gives two or more results at the same time.
- One model handles all target variables together.
- Use multiple features to make predictions.
- If targets are connected, the model learns them better together.
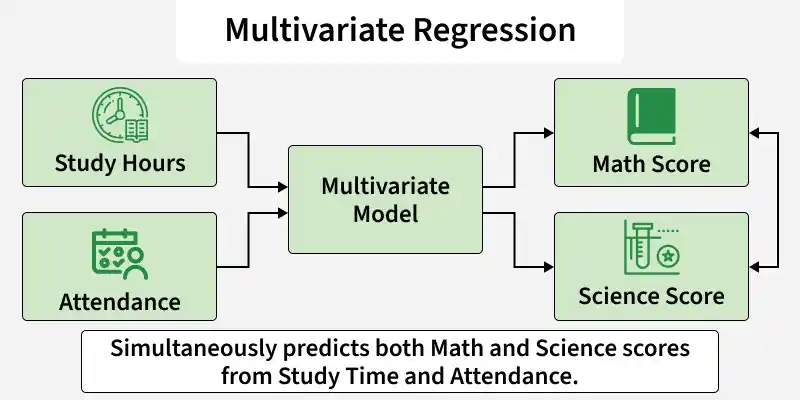
Multivariate Regression
For example, using study hours and attendance to predict both Math and Science marks at the same time.
Architecture
To clearly understand multivariate regression, let’s first recall simple linear regression. In simple linear regression, we predict one output using one input. But in multivariate regression, we predict multiple outputs together using input features. Instead of a single equation, we use matrix form to handle multiple targets at once.
The mathematical form of multivariate regression is:
Y = XB + \epsilon
This equation looks compact, but it represents predicting multiple outputs together in one structured computation. Here:
- Y: Matrix of multiple outputs (for example: Math and Science scores)
- X: Matrix of input features (for example: study hours, attendance)
- B: Coefficient matrix (contains weights for each output)
- \epsilon: Error term (difference between actual and predicted values)
Working of Multivariate Regression
Multivariate regression works in a structured sequence. First, we organize the data into matrices. Then we compute the coefficient matrix using a mathematical formula. Finally, we use those coefficients to generate predictions for all output variables at once.
Step 1: Prepare Input and Output Matrices
We organize the dataset into two main matrices:
- X: Matrix of input features (eg. Area and Rooms)
- Y: Matrix of multiple target variables (eg. Price and Rent)
Step 2: Estimate Coefficients
To find the best coefficient matrix B, we use the normal equation (extended for multiple outputs). This formula finds the best weights that minimize prediction error:
B = (X^T X)^{-1} X^T Y
Here:
- X^T: Transpose of matrix X (rows become columns)
- (X^T X)^{-1}: Inverse of the matrix X^T X
- Multiplying everything gives us B, the coefficient matrix
Step 3: Make Predictions
Once we calculate B, we generate predictions using:
\hat{Y} = XB
Implementation Using Scikit-Learn
We will implement multivariate regression using an inbuilt dataset from Scikit-learn.
Step 1: Import Required Libraries
- **make_regression: Creates synthetic regression data
- **train_test_split: Splits data into training and testing sets
- **LinearRegression: Builds the regression model
- **r2_score: Evaluates model performance Python `
import numpy as np from sklearn.datasets import make_regression from sklearn.model_selection import train_test_split from sklearn.linear_model import LinearRegression from sklearn.metrics import r2_score
`
Step 2: Generate Multi Output Dataset
- **500 samples: No. of rows
- **5 features: Input variables
- **3 targets: Multiple outputs
- **noise=10: Adds small randomness
- **random_state=42: Ensures reproducibility Python `
X, Y = make_regression( n_samples=500, n_features=5, n_targets=3, noise=10, random_state=42 )
`
Step 3: Split the Dataset
- **Training data (80%): Used to learn coefficients
- **Testing data (20%): Used to evaluate performance Python `
X_train, X_test, Y_train, Y_test = train_test_split( X, Y, test_size=0.2, random_state=42 )
`
Step 4: Train the Multivariate Model
- The model learns coefficient matrix B
- It finds the best weights that minimize prediction error.
- Since Y_train has 3 columns, the model automatically performs multivariate regression. Python `
model = LinearRegression() model.fit(X_train, Y_train)
`
**Output:
Model created
Step 5: Make Predictions
- Multiplies input features with learned coefficients
- Produces predictions for all 3 outputs simultaneously Python `
Y_pred = model.predict(X_test)
`
Step 6: Evaluate Performance
Here we get R² value corresponds to one target variable
Python `
r2 = r2_score(Y_test, Y_pred, multioutput='raw_values') print("R² for each output:", r2)
`
**Output:

Output
You can download the code from here
Multiple Linear Regression vs Multivariate Regression
| Multiple Linear Regression | Multivariate Regression | |
|---|---|---|
| Outputs | One dependent variable | More than one dependent variable |
| Inputs | Multiple inputs allowed | Multiple inputs allowed |
| Model Structure | Separate model for each output | Single combined model |
| Output Relationship | Does not consider relation between outputs | Learns relationships among outputs |
| Coefficient Form | Coefficient vector | Coefficient matrix |
Advantages
- One model generates predictions for all target variables at the same time.
- If targets are correlated, the model learns these connections jointly.
- Reduces computational redundancy and simplifies maintenance.
- Shared patterns across outputs improve overall prediction quality.
Limitations
Multivariate regression is useful, but it has certain assumptions and practical challenges.
- Assumes inputs and outputs are linearly related. If the relationship is nonlinear, performance may decrease.
- If input features are highly correlated with each other, coefficient estimates can become unstable.
- Since multiple outputs are being predicted, more data is needed for reliable learning.
- As the number of target variables increases, understanding and explaining the coefficient matrix becomes more complex.