SciPy Agglomerative Clustering (original) (raw)
Last Updated : 23 Jul, 2025
Agglomerative clustering, also known as hierarchical clustering, is one of the most popular clustering techniques in data analysis and machine learning. It builds a hierarchy of clusters through a bottom-up approach, where each data point starts as its own cluster, and pairs of clusters are merged at each iteration based on their similarity until a desired cluster structure is formed.
In this article, **We will cover all the relevant theoretical concepts and provide practical examples to ensure a deep understanding of this topic.
Table of Content
- What Is Agglomerative Clustering?
- Steps Involved in Agglomerative Clustering
- Implementing Agglomerative Clustering Using SciPy
What Is Agglomerative Clustering?
Agglomerative clustering is a type of hierarchical clustering method, where the algorithm starts with each data point as its own individual cluster. The clusters are then merged iteratively based on a specific criterion, such as distance or linkage method, until a certain stopping criterion (e.g., number of clusters) is reached.
**Key Features of Agglomerative Clustering:
- **Hierarchical structure: It generates a hierarchy of clusters, typically visualized using a dendrogram.
- **Distance metric: Determines how similar two clusters or data points are.
- **Linkage criterion: Determines how the distance between clusters is measured.
Steps Involved in Agglomerative Clustering
The agglomerative clustering process generally follows these steps:
- **Initialization: Each data point starts as its own cluster.
- **Distance Matrix Calculation: A distance matrix is computed to determine the similarity between data points or clusters.
- **Cluster Merging: The closest pair of clusters is merged based on a chosen linkage criterion.
- **Update Distance Matrix: After merging, the distance matrix is updated to reflect the new distances between clusters.
- **Repeat: The process of merging and updating the distance matrix is repeated until the stopping criterion is met, such as the desired number of clusters.
Implementing Agglomerative Clustering Using SciPy
We will use the **scipy.cluster.hierarchy module to implement agglomerative clustering. This module provides various functions for hierarchical clustering and allows for the visualization of the dendrogram, a tree-like diagram representing the merging of clusters.
**Step 1: Import Required Libraries
Python `
import numpy as np import matplotlib.pyplot as plt from scipy.cluster.hierarchy import dendrogram, linkage from scipy.spatial.distance import pdist
`
**Step 2: Generate Sample Data
Python `
Generate random data points for clustering
np.random.seed(42) data = np.random.randn(50, 2)
`
**Step 3: Compute the Linkage Matrix
The linkage function is used to compute the hierarchical clustering based on the data. You can specify the linkage method (e.g., 'single', 'complete', 'average', or 'ward').
Python `
Compute the linkage matrix
Z = linkage(data, method='ward')
`
**Step 4: Visualize the Dendrogram
A dendrogram is useful to visualize the hierarchical relationships between clusters. You can use the dendrogram function from SciPy to create the plot.
Python `
Create a dendrogram to visualize the hierarchical clustering
plt.figure(figsize=(10, 6)) dendrogram(Z) plt.title('Dendrogram for Agglomerative Clustering') plt.xlabel('Sample Index') plt.ylabel('Distance') plt.show()
`
**Output:
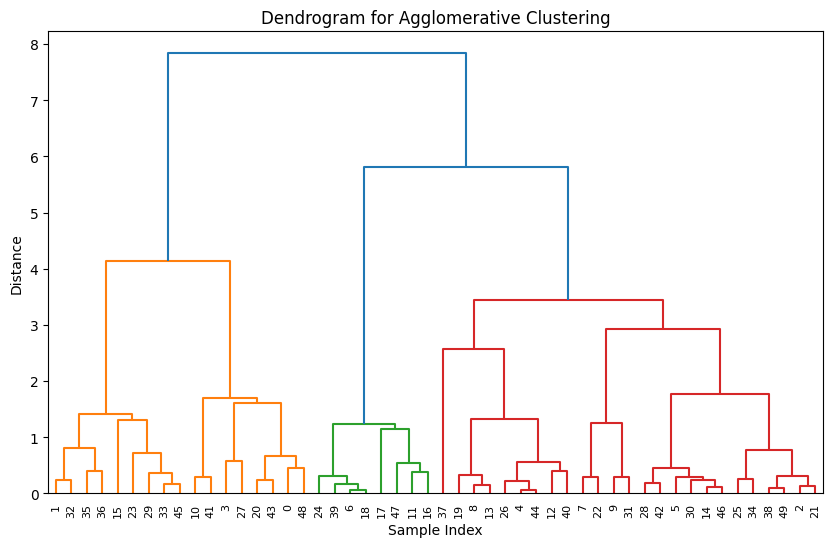
SciPy - Agglomerative Clustering
The dendrogram represents the hierarchical relationships between clusters. Each leaf in the dendrogram corresponds to a single data point, and the merging of clusters is represented by vertical lines. The height of each vertical line represents the distance at which the clusters are merged. Important Concepts in Dendrograms:
- **Cutting the Dendrogram: You can cut the dendrogram at a specific distance to form flat clusters.
- **Inconsistency: The inconsistency in the dendrogram shows how clusters at different levels of the hierarchy differ from one another. Larger inconsistencies suggest less similarity between clusters.
**Step 5: Form Clusters Based on a Distance Threshold
You can cut the dendrogram at a certain distance to form clusters. The fcluster function can be used to achieve this.
Python `
from scipy.cluster.hierarchy import fcluster
Form flat clusters by cutting the dendrogram at a specified distance
max_distance = 1.5 clusters = fcluster(Z, max_distance, criterion='distance')
Plot the clustered data
plt.scatter(data[:, 0], data[:, 1], c=clusters, cmap='rainbow') plt.title('Data Points Clustered Using Agglomerative Clustering') plt.show()
`
**Output:
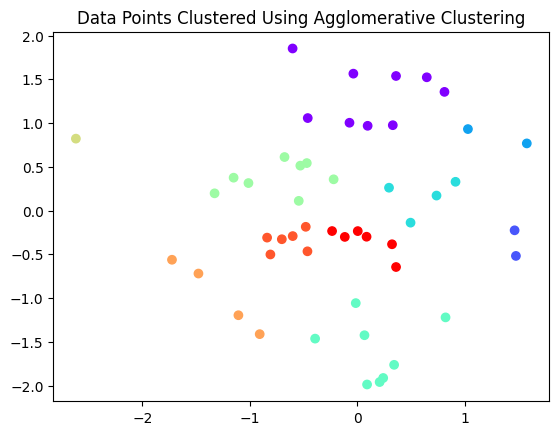
SciPy - Agglomerative Clustering
Conclusion
Agglomerative clustering is a powerful and flexible method for hierarchical clustering that builds a hierarchy of clusters in a bottom-up approach. Using the SciPy library, we can easily implement and visualize this clustering method through the use of functions like linkage, dendrogram, and fcluster. Although the algorithm can be computationally expensive for large datasets, its interpretability and flexibility make it an excellent choice for many real-world applications.