Implementing Agglomerative Clustering using Sklearn (original) (raw)
Last Updated : 2 May, 2026
Agglomerative Clustering is one of the most common hierarchical clustering technique where each data point starts in its own group (cluster) and step by step the closest clusters are joined together until we reach one big cluster. It's a bottom-up approach meaning:
- Each data point starts in its own cluster.
- Pairs of clusters are merged step-by-step based on a linkage criterion like shortest distance until all points are merged into a single cluster or until a desired number of clusters is formed.
It's used in marketing, biology, education and fraud detection to find natural patterns in data. Let's implement it step by step:
Step 1: Importing the required libraries
First we will import all the necessary libraries like numpy , pandas, matplotlib and scikit learn.
Python `
import pandas as pd import numpy as np import matplotlib.pyplot as plt from sklearn.decomposition import PCA from sklearn.cluster import AgglomerativeClustering from sklearn.preprocessing import StandardScaler, normalize from sklearn.metrics import silhouette_score import scipy.cluster.hierarchy as shc
`
Step 2: Loading and Cleaning the data
We will now read the .csv file and clean it.
- Remove the **CUST_ID column since it's just an ID and not useful
- Handle missing values using forward fill.
You can download the dataset from here
Python `
data = pd.read_csv('CC_GENERAL.csv')
data.drop('CUST_ID', axis=1, inplace=True)
data.fillna(method='ffill', inplace=True)
print(data.head())
`
**Output:
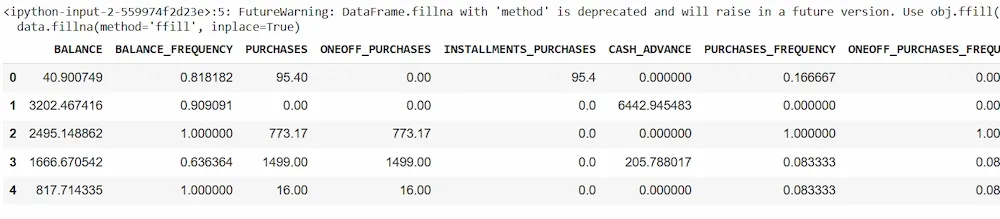
Dataset
Step 3: Preprocessing the data
We prepare the data so that all features are on the same scale.
- **Scaling makes features comparable It is important because clustering depends on distance.
- **Normalization helps the clustering algorithm work better. Python `
X = data scaler = StandardScaler() X_scaled = scaler.fit_transform(X)
X_normalized = normalize(X_scaled)
X_normalized = pd.DataFrame(X_normalized)
`
Step 4: Reducing the dimensionality of the Data
We use PCA to reduce many columns features to just 2 so we can easily visualize the data.
Python `
pca = PCA(n_components = 2) X_principal = pca.fit_transform(X_normalized) X_principal = pd.DataFrame(X_principal) X_principal.columns = ['P1', 'P2']
`
Step 5: Make the Dendrograms
A **dendrogram helps us decide how many clusters to choose. We will use the matplotlib to plot it.
Python `
plt.figure(figsize =(8, 8)) plt.title('Visualising the data') Dendrogram = shc.dendrogram((shc.linkage(X_principal, method ='ward')))
`
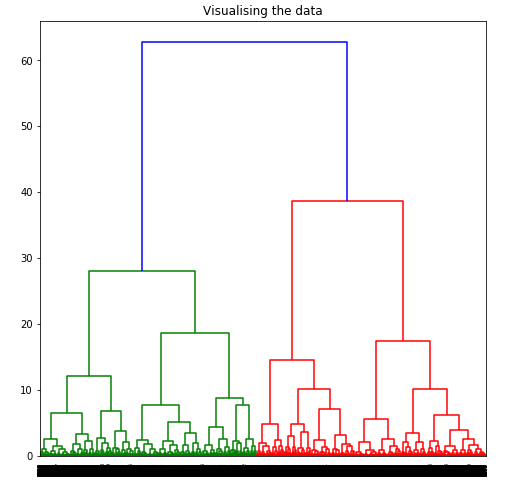
To determine the optimal number of clusters by visualizing the data, imagine all the horizontal lines as being completely horizontal and then after calculating the maximum distance between any two horizontal lines, draw a horizontal line in the maximum distance calculated.
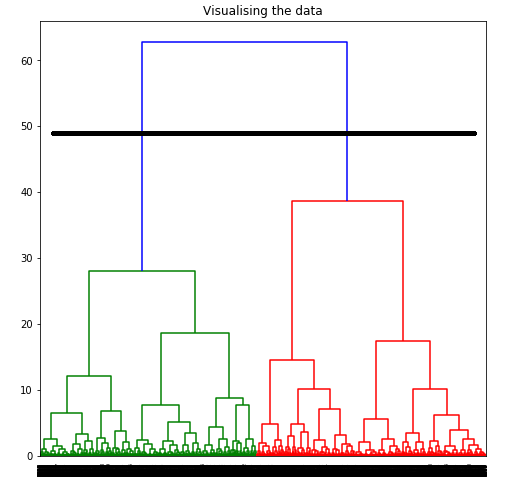 The above image shows that the optimal number of clusters should be 2 for the given data.
Step 6: Apply Agglomerative Clustering for Different Values of k
Now let’s apply clustering for different values of k (number of clusters). For each value of k we created a clustering model and plot the two PCA components colored by cluster.
Python `
for k in range(2, 7): # Try values from 2 to 6 model = AgglomerativeClustering(n_clusters=k) labels = model.fit_predict(X_principal)
plt.figure(figsize=(6, 6))
plt.scatter(X_principal['P1'], X_principal['P2'], c=labels, cmap='rainbow')
plt.title(f'Agglomerative Clustering (k={k})')
plt.xlabel('P1')
plt.ylabel('P2')
plt.show()
`
**Output:
Step 7: Evaluate models and Visualizing results
Silhouette score tells us how well the data has been grouped. The Higher the score the better is model.
Python `
k = [2, 3, 4, 5, 6]
silhouette_scores = [] silhouette_scores.append( silhouette_score(X_principal, ac2.fit_predict(X_principal))) silhouette_scores.append( silhouette_score(X_principal, ac3.fit_predict(X_principal))) silhouette_scores.append( silhouette_score(X_principal, ac4.fit_predict(X_principal))) silhouette_scores.append( silhouette_score(X_principal, ac5.fit_predict(X_principal))) silhouette_scores.append( silhouette_score(X_principal, ac6.fit_predict(X_principal)))
plt.bar(k, silhouette_scores) plt.xlabel('Number of clusters', fontsize = 20) plt.ylabel('S(i)', fontsize = 20) plt.show()
`
**Output:
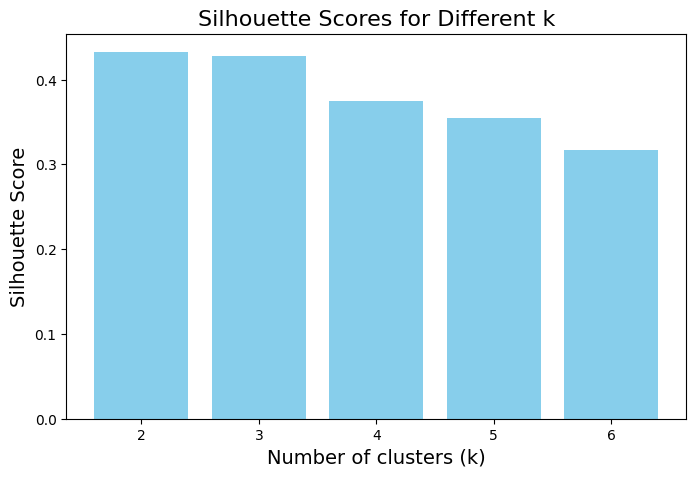
Silhouette Score
As in the above image based on the Silhouette Score and Dendrogram we usually choose the value of k that gives the highest score. In most cases with this dataset the best number of clusters is 2.
To download the complete code: click here