SHAP with a Linear SVC model from Sklearn Using Pipeline (original) (raw)
Last Updated : 23 Jul, 2025
SHAP (SHapley Additive exPlanations) is a powerful tool for interpreting machine learning models by assigning feature importance based on Shapley values. In this article, we will explore how to integrate SHAP with a linear SVC model from Scikit-learn using a Pipeline. We'll provide an overview of SHAP, discuss how to build an SVC model, and illustrate how to interpret the model with SHAP.
Table of Content
- Understanding SHAP and Linear SVC
- Setting Up the Pipeline with Linear SVC
- Building a Linear SVC Model with Scikit-learn Pipeline
- Applying SHAP to Linear SVC Models
- Visualizing SHAP Explanations for Linear SVC
- Analyzing the SHAP Values
Understanding SHAP and Linear SVC
What is SHAP?
SHAP is a unified framework for interpreting predictions. It connects game theory with local explanations, providing a way to explain individual predictions by computing the contribution of each feature to the prediction. SHAP values are based on Shapley values from cooperative game theory, ensuring a fair distribution of contributions among features.
Linear SVC in Scikit-learn
Linear SVC is a type of Support Vector Machine (SVM) that uses a linear kernel. It is efficient for text classification and other high-dimensional datasets. Unlike the SVC class, LinearSVC does not provide support vectors directly, but it is often preferred for its speed and efficiency in handling large datasets.
By combining SHAP with a linear SVC model, we can better understand which features influence the classification decisions made by the SVC model.
Setting Up the Pipeline with Linear SVC
**A Pipeline in scikit-learn is a tool that simplifies the process of building machine learning workflows. It allows you to chain together multiple processing steps, such as data transformation and model fitting, into a single object. This is particularly useful for ensuring that all steps are applied consistently to both training and test data.
To create a Pipeline with Linear SVC, you typically include steps for data preprocessing and model training. Here is a basic setup:
Before diving into the implementation, ensure you have the necessary libraries installed. You will need Scikit-learn, SHAP, and other standard Python libraries for data processing.
pip install shap
Next, we import the required libraries:
Python `
import numpy as np import pandas as pd from sklearn.svm import SVC from sklearn.pipeline import Pipeline from sklearn.preprocessing import StandardScaler from sklearn.model_selection import train_test_split import shap
`
Preprocessing Data for SVC Models
We’ll use a sample dataset, such as the breast cancer dataset from Scikit-learn, which contains labeled data for binary classification.
Python `
from sklearn.datasets import load_breast_cancer data = load_breast_cancer() X = pd.DataFrame(data['data'], columns=data['feature_names']) y = data['target']
Split data into training and test sets
X_train, X_test, y_train, y_test = train_test_split(X, y, test_size=0.2, random_state=42)
`
Linear SVC models are sensitive to feature scaling, so we’ll scale the data using StandardScaler. This will normalize the features to have zero mean and unit variance.
Building a Linear SVC Model with Scikit-learn Pipeline
In this section, we’ll construct a pipeline with two steps: scaling the data and applying the linear SVC model.
Now, creating the pipeline:
Python `
Create a pipeline with StandardScaler and LinearSVC
svc_pipeline = Pipeline([ ('scaler', StandardScaler()), ('svc', SVC(kernel='linear', probability=True)) ])
Fit the pipeline on the training data
svc_pipeline.fit(X_train, y_train)
`
**Output:
Pipeline
StandardScaler
SVC
**Benefits of Using Pipelines for SVC:
- **Consistency: The same scaling is applied during training and testing.
- **Modularity: You can easily swap out the classifier or add additional preprocessing steps without modifying the entire code.
Applying SHAP to Linear SVC Models
SHAP explainers help you calculate the Shapley values for each feature in your model. SHAP supports a wide range of model explainers, including:
- Linear explainers for linear models.
- Kernel explainers for non-linear models.
Since we are using a linear model, we will use SHAP’s LinearExplainer.
Now that we’ve trained our model using the pipeline, we can use SHAP to interpret it. We’ll use the LinearExplainer for our linear SVC model.
Python `
5. Initialize the SHAP Linear Explainer (corrected parameter)
explainer = shap.LinearExplainer(svc_pipeline.named_steps['svc'], X_train, feature_perturbation="correlation_dependent")
shap_values = explainer.shap_values(X_test)
`
In the code above, the LinearExplainer takes the SVC model and training data as input. The shap_values are the Shapley values that explain how each feature contributed to the model’s predictions.
Visualizing SHAP Explanations for Linear SVC
A summary plot helps visualize the magnitude and direction of feature importance across the dataset.
Python `
7. Visualize SHAP summary plot for global feature importance
shap.summary_plot(shap_values, X_test)
8. Visualize SHAP force plot for the first instance's prediction
shap.force_plot(explainer.expected_value, shap_values[0, :], X_test.iloc[0, :], matplotlib=True)
`
**Output:
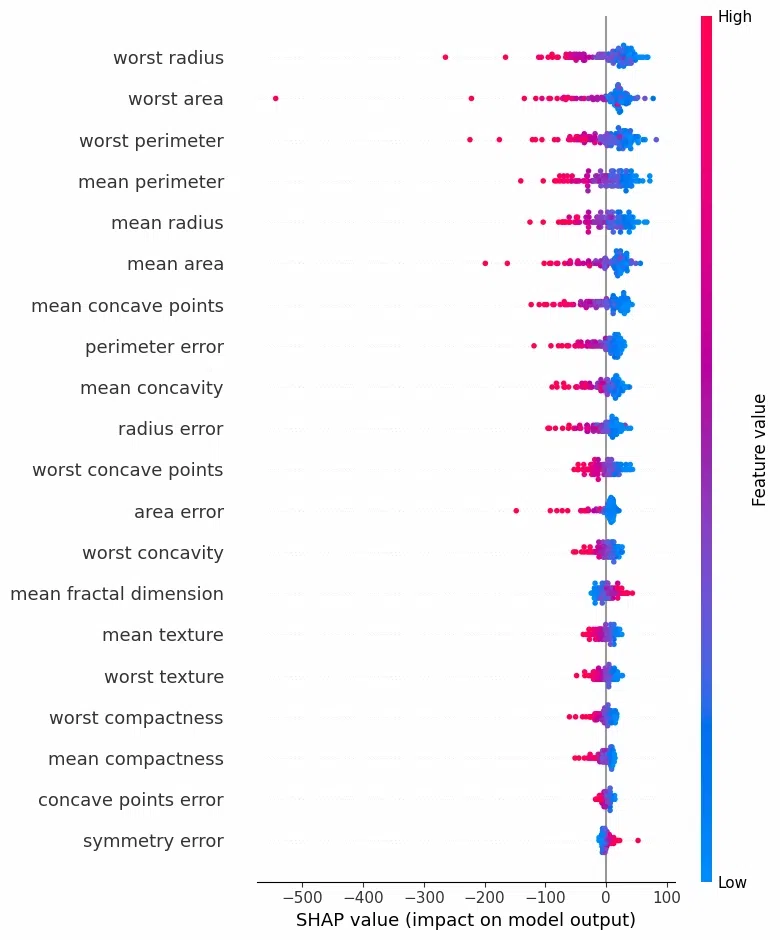
Visualizing SHAP Explanations for Linear SVC
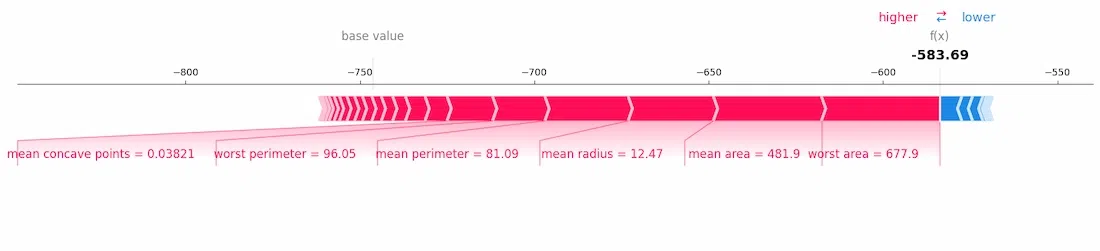
Visualizing SHAP Explanations for Linear SVC
Analyzing the SHAP Values
1. Feature Impact Analysis
Using the SHAP values, you can determine which features have the most influence on the linear SVC model. For example, a positive SHAP value means that a feature pushes the prediction toward the positive class, while a negative value indicates the opposite.
2. Feature Interaction
Although SHAP is typically used to assess individual feature importance, it can also provide insights into feature interactions by visualizing relationships between SHAP values for pairs of features.
Python `
shap.dependence_plot('mean radius', shap_values, X_test)
`
**Output:
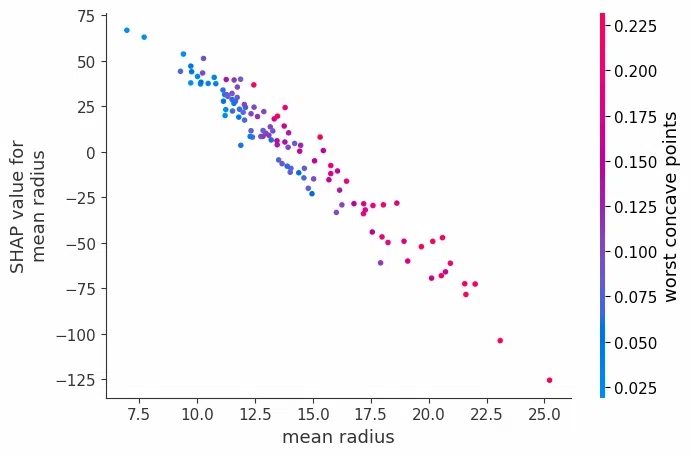
Analyzing the SHAP Values
Conclusion
By integrating SHAP with a linear SVC model from Scikit-learn using a Pipeline, you can gain a deeper understanding of how your model makes decisions. SHAP’s visualizations, such as summary plots and force plots, offer clear insights into which features are driving your model’s predictions. The use of Scikit-learn pipelines ensures that preprocessing steps are consistent and modular, making it easier to scale your workflow.