Class 8 RD Sharma Solutions Chapter 25 Data Handling III (Pictorial Representation Of Data As Pie Charts Or Circle Graphs) Exercise 25.1 | Set 2 (original) (raw)
Last Updated : 23 Jul, 2025
Class 8 RD Sharma Solutions - Chapter 25 Data Handling III (Pictorial Representation Of Data As Pie Charts Or Circle Graphs) - Exercise 25.1 | Set 2
Today in this Article we are going to look at the answer of a renowned book named RD Sharma for class 8 Chapter 25 Data Handling III (Pictorial Representation Of Data As Pie Charts Or Circle Graphs) - Exercise 25.1 | Set 2. So let's first see the question.
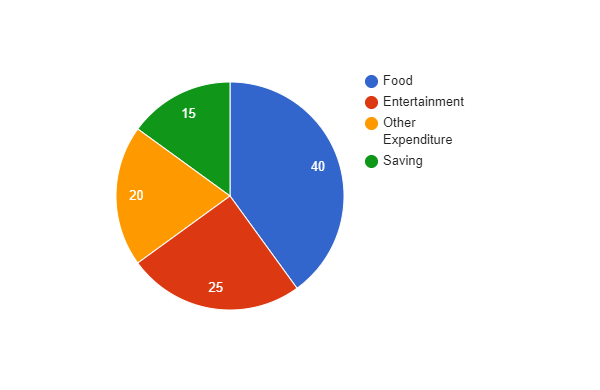
Question 11. The following table shows how a student spends his pocket money during the course of a month. Represent it by a **pie diagram.
| **Items | **Food | **Entertainment | **Other Expenditure | **Saving |
|---|---|---|---|---|
| **Expenditure (in %) | **40 | **25 | **20 | **15 |
**Solution:
Given that, total Expenditure = 100%
Therefore,
Central angle = (component value/100) × 360°
Now the central angle for each activity will be calculated as follows:
**Items **Expenditure (in %) **Central Angle Food 40 40/100 * 360 = 144 Entertainments 25 25/100 * 360 = 90 Other Expenditure 20 20/100 * 360 = 72 Saving 15 15/100 * 360 = 54 Steps to construct pie chart using above data :
**Step 1. First draw the circle of an appropriate radius.
**Step 2. Now draw a vertical radius anywhere inside the circle.
**Step 3. Now choose the largest central angle. Construct a sector of central angle, whose one radius coincides with the radius drawn in step 2 and the other radius is in clockwise direction to the vertical radius.
**Step 4. Construct other sectors representing other values in clockwise direction in descending order of values of their central angles.
**Step 5. Shade the sectors so obtained by different colors and label them.
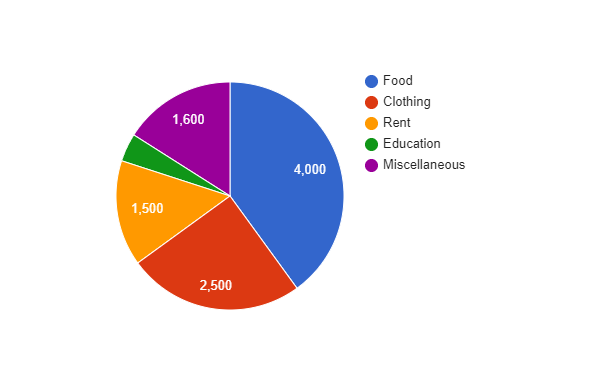
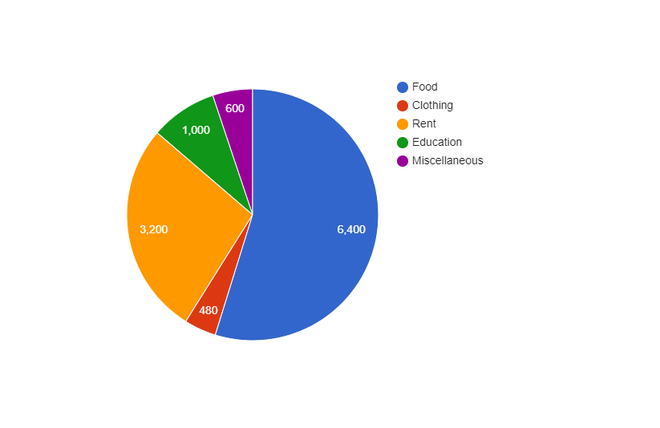
Question 12. Represent the following data by a **pie chart:
| **Items of Expenditure | **Expenditure |
|---|---|
| **Family A Family B | |
| **Food | **4000 6400 |
| **Clothing | **2500 480 |
| **Rent | **1500 3200 |
| **Education | **400 1000 |
| **Miscellaneous | **1600 600 |
| **Total | **10000 16000 |
**Solution:
Given that, the total expenditure of family A = 10000 and family B = 11680
Central angle for family A = (component value/10000) × 360°
Central angle for family B = (component value/11680) × 360°
Now the central angle for each activity will be calculated as follows :
**Items of Expenditure **Expenditure Family A **Expenditure Family B **Central Angle of Family A **Central Angle of Family B Food 4000 6400 4000/10000 * 360 = 144 6400/11680 * 360 = 197.6 Clothing 2500 480 2500/10000 * 360 = 90 480/11680 * 360 = 14.8 Rent 1500 3200 1500/10000 * 360 = 54 3200/11680 * 360 = 98.6 Education 400 1000 400/10000 * 360 = 14.4 1000/11680 * 360 = 30.8 Miscellaneous 1600 600 1600/10000 * 360 =57.6 600/11680 * 360 = 18.5 Steps to construct pie chart using above data :
**Step 1. First draw the circle of an appropriate radius.
**Step 2. Now draw a vertical radius anywhere inside the circle.
**Step 3. Now choose the largest central angle then construct a sector of central angle, whose one radius coincides with the radius drawn in step 2 and the other radius is in clockwise direction to the vertical radius.
**Step 4. Construct other sectors representing other values in clockwise direction in descending order of values of their central angles.
**Step 5. Shade the sectors so obtained by different colors and label them.
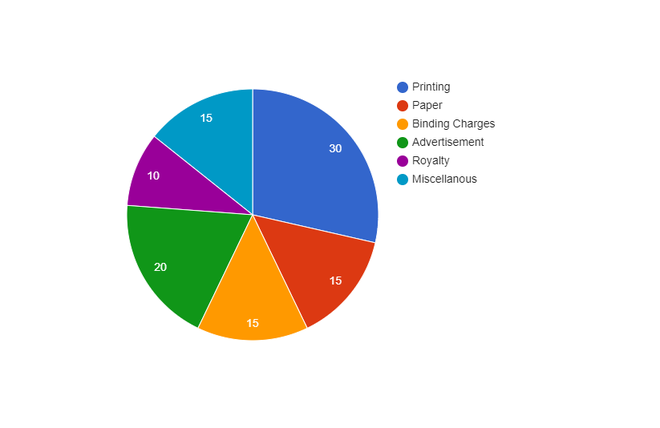
**Question 13. Following data gives the break up of the cost of production of a book:
| **Printing | **Paper | **Binding Charges | **Advertisement | **Royalty | **Miscellaneous |
|---|---|---|---|---|---|
| **30% | **15% | **15% | **20% | **10% | **15% |
**Draw a **pie chart depicting the above information.
**Solution:
Given that, total cost of production of book = 105%
Therefore,
Central angle = (component value/105) × 360°
Now the central angle for each activity will be calculated as follows :
**Items **Expenditure (in %) **Central Angle Printing 30 30/105 * 360 = 102.9 Paper 15 15/105 * 360 = 51.4 Binding Charges 15 15/105 * 360 = 51.4 Advertisement 20 20/105 * 360 = 68.6 Royalty 10 10/105 * 360 = 34.3 Miscellaneous 15 15/105 * 360 = 51.4 Steps to construct pie chart using above data :
**Step 1. First draw the circle of an appropriate radius.
**Step 2. Now draw a vertical radius anywhere inside the circle.
**Step 3. Now choose the largest central angle. Then construct a sector of central angle, whose one radius coincides with the radius drawn in step 2 and the other radius is in clockwise direction to the vertical radius.
**Step 4. Construct other sectors representing other values in clockwise direction in descending order of values of their central angles.
**Step 5. Shade the sectors so obtained by different colors and label them.
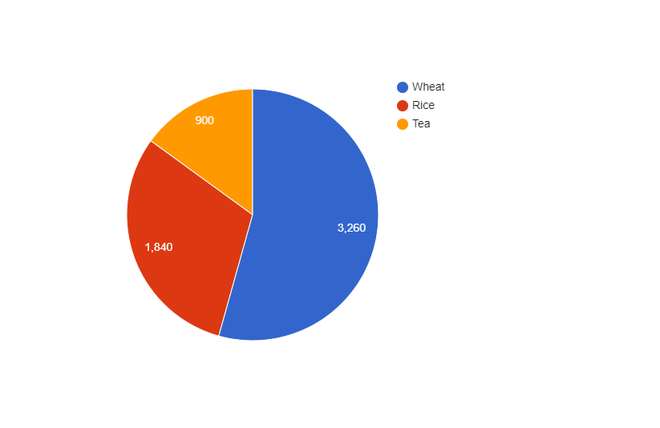
Question 14. Represent the following data with the help of **pie chart:
| **Items | **Wheat | **Rice | **Tea |
|---|---|---|---|
| **Production (in metric tons) | **3260 | **1840 | **900 |
**Solution:
Given that, total cost of production = 6000 metric tons
Therefore,
Central angle = (component value/6000) × 360°
Now the central angle for each activity will be calculated as follows :
**Items **Production **Central Angle Wheat 3260 3260/6000 * 360 = 195.6 Rice 1840 1840/6000 * 360 = 110.4 Tea 900 900/6000 * 360 = 54 Steps to construct pie chart using above data :
**Step 1. First draw the circle of an appropriate radius.
**Step 2. Now draw a vertical radius anywhere inside the circle.
**Step 3. Now choose the largest central angle then construct a sector of central angle, whose one radius coincides with the radius drawn in step 2 and the other radius is in clockwise direction to the vertical radius.
**Step 4. Construct other sectors representing other values in clockwise direction in descending order of values of their central angles.
**Step 5. Shade the sectors so obtained by different colors and label them.
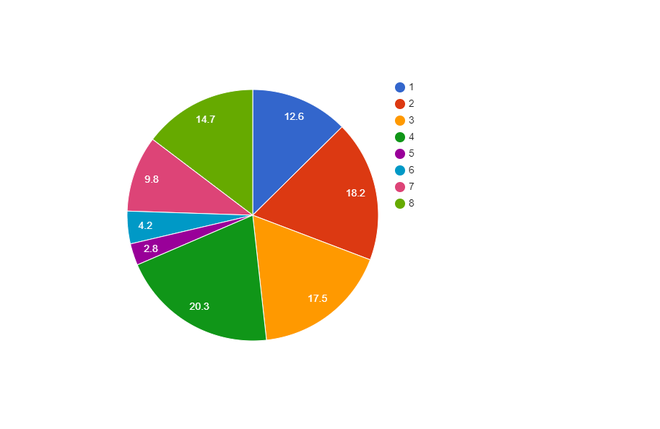
**Question 15. Draw a pie-diagram representing the relative frequencies (expressed as percentage) of the eight classes as given below:
**12.6, 18.2, 17.5, 20.3, 2.8, 4.2, 9.8, 14.7
**Solution:
Given that, total amount = 100.1%
Therefore,
Central angle = (component value/100.1) × 360°
Now the central angle for each activity will be calculated as follows :
**Class **Amount (in %) **Central Angle 1 12.6 12.6/100.1 * 360 = 45.3 2 18.2 18.2/100.1 * 360 = 65.5 3 17.5 17.5/100.1 * 360 = 62.9 4 20.3 20.3/100.1 * 360 = 73 5 2.8 2.8/100.1 * 360 = 10.1 6 4.2 4.2/100.1 * 360 = 15.1 7 9.8 9.8/100.1 * 360 = 35.2 8 14.7 14.7/100.1 * 360 = 52.9 Steps to construct pie chart using above data :
**Step 1. First draw the circle of an appropriate radius.
**Step 2. Now draw a vertical radius anywhere inside the circle.
**Step 3. Now choose the largest central angle then construct a sector of central angle, whose one radius coincides with the radius drawn in step 2 and the other radius is in clockwise direction to the vertical radius.
**Step 4. Construct other sectors representing other values in clockwise direction in descending order of values of their central angles.
**Step 5. Shade the sectors so obtained by different colors and label them.
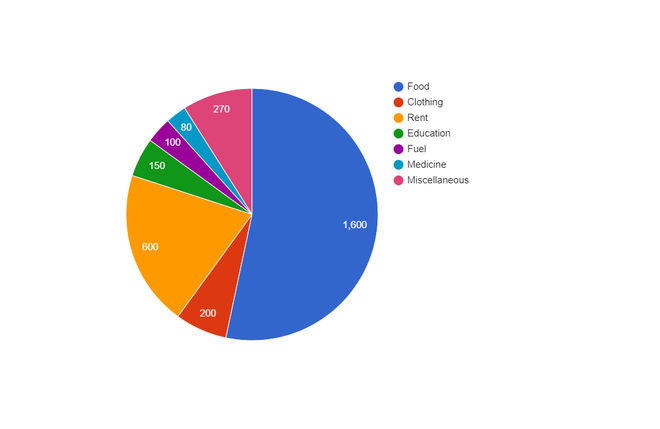
**Question 16. Following is the break up of the expenditure of a family on different items of consumption:
| **Items | **Food | **Clothing | **Rent | **Education | **Fuel etc | **Medicine | **Miscellaneous |
|---|---|---|---|---|---|---|---|
| **Expenditure (in Rs) | **1600 | **200 | **600 | **150 | **100 | **80 | **270 |
**Draw a pie-diagram to represent the above data.
**Solution:
Given that, total expenditure = 3000 Rs
Therefore,
Central angle = (component value/3000) × 360°
Now the central angle for each activity will be calculated as follows :
**Items **Expenditure (in Rs) **Central Angle Food 1600 1600/3000 * 360 = 192 Clothing 200 200/3000 * 360 = 24 Rent 600 600/3000 * 360 = 72 Education 150 150/3000 * 360 = 18 Fuel 100 100/3000 * 360 = 12 Medicine 80 80/3000 * 360 = 9.6 Miscellaneous 270 270/3000 * 360 = 32.4 Steps to construct pie chart using above data :
**Step 1. First draw the circle of an appropriate radius.
**Step 2. Now draw a vertical radius anywhere inside the circle.
**Step 3. Now choose the largest central angle then construct a sector of central angle, whose one radius coincides with the radius drawn in step 2 and the other radius is in clockwise direction to the vertical radius.
**Step 4. Construct other sectors representing other values in clockwise direction in descending order of values of their central angles.
**Step 5. Shade the sectors so obtained by different colors and label them.
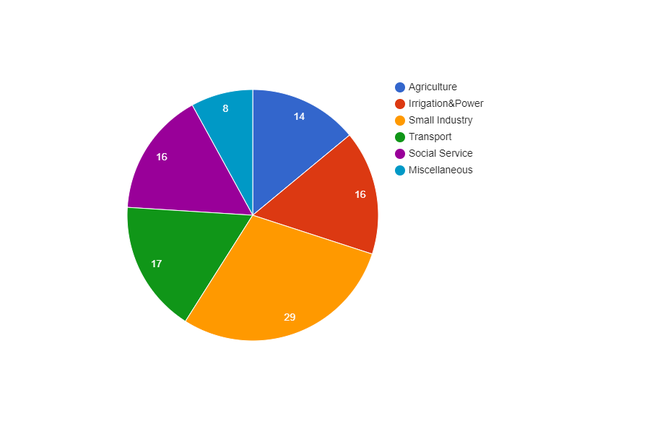
**Question 17. Draw a pie diagram for the following data of the investment pattern in a five years plan:
| **Agriculture | **Irrigation and Power | **Small Industries | **Transport | **Social Service | **Miscellaneous |
|---|---|---|---|---|---|
| **14% | **16% | **29% | **17% | **16% | **8% |
**Solution:
Given that, total investment = 100%
Therefore,
Central angle = (component value/100) × 360°
Now the central angle for each activity will be calculated as follows :
**Data **Investment (in %) **Central Angle Agriculture 14 14/100 * 360 = 50.4 Irrigation and Power 16 16/100 * 360 = 57.6 Small Industries 29 29/100 * 360 = 104.4 Transport 17 17/100 * 360 = 61.2 Social Services 16 16/100 * 360 = 57.6 Miscellaneous 8 8/100 * 360 = 28.8 Steps to construct pie chart using above data :
**Step 1. First draw the circle of an appropriate radius.
**Step 2. Now draw a vertical radius anywhere inside the circle.
**Step 3. Now choose the largest central angle then construct a sector of central angle, whose one radius coincides with the radius drawn in step 2 and the other radius is in clockwise direction to the vertical radius.
**Step 4. Construct other sectors representing other values in clockwise direction in descending order of values of their central angles.
**Step 5. Shade the sectors so obtained by different colors and label them.