Estimation in Statistics (original) (raw)
Last Updated : 31 Jul, 2025
Estimation is a technique for calculating information about a bigger group from a smaller sample, and statistics are crucial to analyzing data.
For instance, the average age of a city's population may be obtained by taking the age of a sample of 1,000 residents. While estimates aren't perfect, they are typically trustworthy enough to be of value.
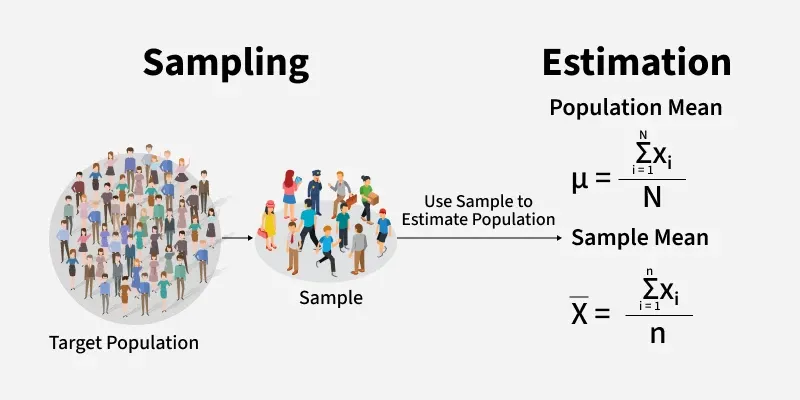
Estimation in statistics involves using sample data to make educated guesses about a population's characteristics, such as mean, variance, or proportion. The population refers to the entire interest group, like all people in a country or all products made by a company.
Since it's often impractical to measure every member of a population, statisticians rely on samples to make inferences about the entire population.
Estimation helps to conclude population parameters based on sample data.
- **Bias and Variance: Estimators can have bias, consistently overestimating or underestimating the true parameter. Variance measures the spread of estimator values around their predicted value. Both variance and bias impact the accuracy of estimators.
- **Mean and Variance of Estimators: Estimators have the same mean and variance as random variables. The mean of an estimator should be equal to the parameter it is estimating. The variance of an estimator indicates its precision or variability.
In this article, we examine the significance of statistics, their function in the interpretation of data, and how efficient data analysis leads to the making of decisions based on accurate information.
Purpose of Estimation in Statistics
Statistical estimation is essential for finding unknown population parameters using sample data, like the mean and variance, without individual measurements.
- This evaluation is vital for decision-making in business and healthcare, informing strategies and treatment options.
- It is closely linked to hypothesis testing, contributing to scientific development, political decisions, public health, and economic choices.
- Risk assessment benefits from evaluation in managing probabilities and risk in finance and insurance.
- Quality control also relies on evaluation to ensure products and services meet standards by identifying and correcting deviations.
Types of Estimation
Estimation is of two types that include:
- Point Estimation
- Interval Estimation
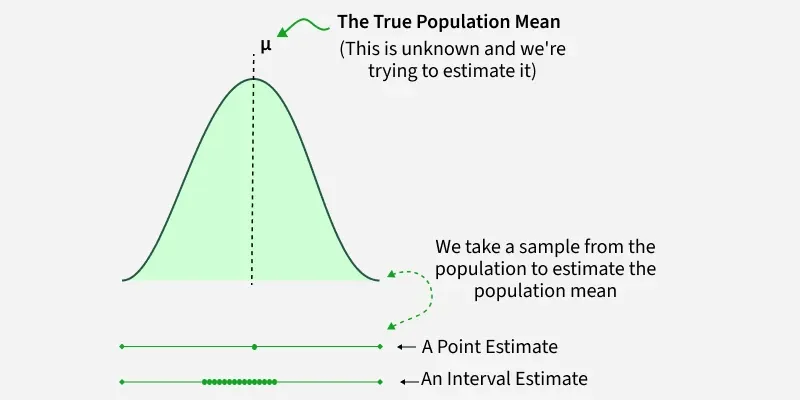
Point Estimation
A single value (called a **point estimate) is used to approximate an unknown population parameter. This single number, called a score estimator, gives a rough idea of the group's characteristics.
The population mean is estimated using the sample mean. Similar techniques can be applied to estimate other attributes, like percentages of specific characteristics in a population. While not always precise, these estimates offer a good understanding of the group's traits.
For instance, measuring the heights of random people can be used to estimate the average height of the entire group. If individuals measured were 5 feet, 6 feet, and 5 feet. We could estimate the average height to be around 5 feet.
**Interval Estimation
Interval estimates give **a range likely to contain the true parameter. This method recognizes data variability and estimation uncertainty.
When estimating the number of jelly beans in a jar, it is better to provide a range, known as a **confidence interval, rather than a single guess. This range, such as 80 to 120 jelly beans, allows for uncertainty in the estimate and acknowledges the margin of error.
Confidence intervals give us a sense of freedom in our estimations, while point estimates only provide a single number without considering this uncertainty.
Confidence Interval in Interval Estimation
A confidence interval is the range of values, derived from a sample, that is likely to contain the true value of an unknown population parameter.
(1-α)% confidence interval means: "If we repeat the experiment many times, then (1 − α)% of the constructed intervals will contain the true parameter."
Example: A 95% confidence level means: "If we took 100 random samples and built 100 confidence intervals, we expect about 95 of them to contain the true population parameter."
Factors Affecting Estimation
Various factors affecting estimation are:
**1. Sample Size: Larger sample sizes lead to more precise estimates, increasing the likelihood of accurately representing the population parameter.
- Estimating the average height of students in a school is more accurate with a larger sample size.
- Measuring just five students may not be reliable, but measuring 50 or even 500 students can provide a better idea of the true average height.
- A larger sample size leads to a more accurate estimate of the entire population's characteristics.
- In short, studying more individuals results in a more precise estimate of the entire population.
**2. Sampling Method: The sampling method affects estimate accuracy. A random sample with every member having an equal chance ensures an unbiased estimate, improving accuracy.
- The sampling method is crucial for accurate estimations.
- Random sampling selects individuals purely by chance, giving each an equal chance of being chosen.
- This ensures a fair representation of the entire group, making it useful for determining distributions like colored candies in a jar or favorite ice cream flavors in a town without bias.
- Random sampling helps reflect the opinions of the whole group, not just a subset, leading to fair and unbiased findings for drawing accurate conclusions about a population or problem.
Estimation Methods
Several statistical techniques are used to estimate unknown parameters from data:
1. Method of Moments
- This method compares the moments (central tendency and spread) that are computed from the sample data to the corresponding moments in the population.
- The population parameters can be estimated by working out the resulting equations.
2. Maximum Likelihood Estimation (MLE)
- Maximum likelihood estimation (MLE) aims to find parameter values that give the highest chance of observing the given sample.
- It involves identifying values that maximize the likelihood of the observed data.
3. Least Squares Estimation
- LSE minimizes the sum of squared differences between observed values and predicted values.
- It’s widely used to find the best fit for a model, especially in regression, by reducing prediction errors.
4. Bayesian Estimation
- Bayesian Estimation updates prior belief about unknown parameters using observed data through Bayes' theorem.
- In Bayesian learning, parameters are random variables with probabilities assigned to them.
5. Interval Estimation
- This approach constructs a range of plausible values (e.g., confidence intervals) for an unknown parameter, reflecting uncertainty with a specified level of confidence.
Applications of Estimations in Computer Science
Machine Learning and AI
- Estimating parameters of models from data (e.g., weights in neural networks, coefficients in regression).
- Example: In **linear regression, we use least squares estimation to find the line of best fit. In Bayesian networks, Bayesian estimation is used to compute posterior probabilities.
Data Compression
- Estimating the probability distribution of symbols for efficient encoding.
- Example: In **Huffman coding, character frequencies are estimated to build optimal prefix codes. In **arithmetic coding, probabilities are estimated in real time to achieve better compression ratios.
Cryptography
- Estimating the entropy of keys or messages to assess strength.
- Example: Estimating the key recovery success rate based on observed ciphertexts.
Computer Graphics and Vision
- Estimating depth, object boundaries, or motion in visual scenes.
- Example: In SLAM (Simultaneous Localization and Mapping), estimation is used to track a robot’s position in space.