Graphing Function (original) (raw)
Last Updated : 27 Apr, 2026
Graphing a function means plotting values on a coordinate plane to show the relationship between input and output. Simple functions like linear and quadratic are easy to plot, while complex ones like rational and logarithmic are harder to graph.
A graph represents a function only if every point on the curve satisfies the function’s equation and every x-value corresponds to exactly one y-value (vertical line test).
For instance, the graph of the linear function is shown below. It is represented as f(x) = -x + 2.
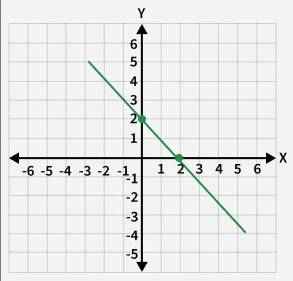
Suppose we move from the start of this line to another point, such as (-1, 3). Let us replace (-1, 3) with (x, y) (i.e., x = -1 and y = 3) and then, in f(x) = -x + 2:
- 3 = -(-1) + 2 = 3; thus, (-1, 3) satisfies the function.
Similarly, plot similar points and check if they satisfy the equation. This process of plotting the points that satisfy the equation is called graphing a function.
Graphing Basic Functions
Graphing simple functions like linear and quadratic functions is straightforward.
- First, find out the standard form if possible. For example, if it is a linear function of the form f(x) = ax + b, then its graph will be a line, and if it is a quadratic function of the type f(x) = ax2 + bx + c, then its graph will be a parabola.
- Next, select some values of x and substitute them into the function to get the corresponding values.
Graphing Linear Functions
Graphing a linear function means plotting points to show the relation between x and y. For f(x) = −x+2:
- Take values of x like x = 0 and x = 1 and substitute them into y = −x + 2 to get points and form a table of values:
| X | Y |
|---|---|
| 0 | -0 + 2 = 2 |
| 1 | -1 + 2 = 1 |
- Plot these points on the coordinate plane.
- Join the points and we will get a straight line representing the function.
Graphing Quadratic Functions
For graphing quadratic functions also, we can find some arbitrary points on it. But this may not give a perfect U-shaped curve. This is because, to get a perfect U-shaped curve, we need to find the turning point (vertex) of the curve. After finding the vertex, we can find two or three arbitrary points on each side of the vertex, and they would help in graphing the function.
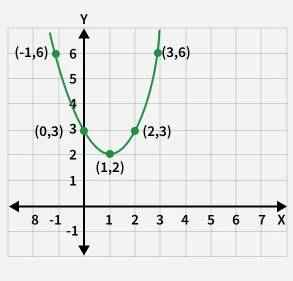
**Example: Graph the quadratic function f(x) = x² - 2x + 5.
**Solution:
- Comparing it with f(x) = ax2 + bx + c, a = 1, b = -2, and c = 5.
- The x-coordinate of the vertex is h = -b / 2a = -(-2) / 2(1) = 1.
- Its y-coordinate is f(1) = 12 - 2(1) + 5 = 4.
Hence, the vertex is (1, 4).
We'll take two arbitrary values on each side of 1 (which is the x-coordinate of the vertex) and frame a table. Also, we can calculate the y-coordinate using the function.
| X | Y |
|---|---|
| -1 | (-1)2 - 2(-1) + 5 = 8 |
| 0 | 02 - 2(0) + 5 = 5 |
| Vertex: 1 | 4 |
| 2 | 22 - 2(2) + 5 = 5 |
| 3 | 32 - 2(3) + 5 = 8 |
Now, we will plot the points (-1, 8), (0, 5), (1, 4), (2, 5), and (3, 8) on a coordinate plane, join them, and extend the curve on both sides.
Graphing Complex Functions
Functions are easier to understand when their domain and range both consist of all real numbers. However, some functions require analysis of domain, range, asymptotes, and holes before graphing. The most popular such functions are the following:
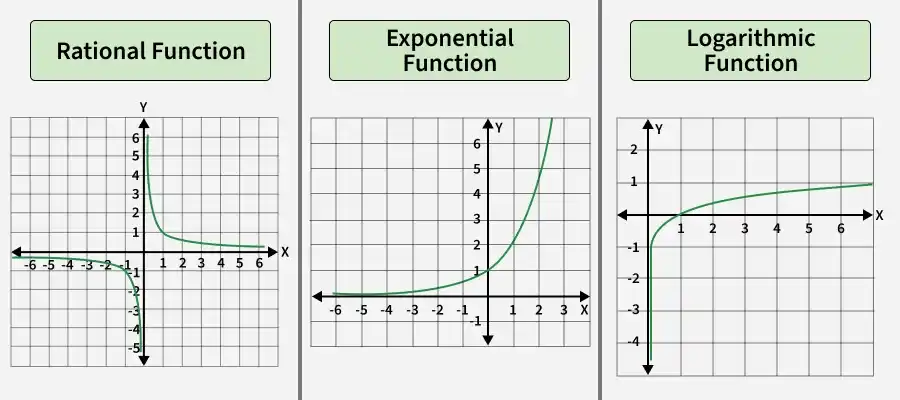
- Rational functions: Its general function is of the form f(x) = 1/x (which is called the reciprocal function).
- Exponential functions: Its general function is of the form f(x) = ex.
- Logarithmic Functions: Its general function is of the form f(x) = logax.
In each of these cases, for graphing functions, we follow the following steps:
- Find the domain and range of the function and keep them in mind while drawing the curve.
- Find the x-intercept(s) and the y-intercept(s), and plot them.
- Identify the holes, if any.
- Find the asymptotes (vertical, horizontal, and slant) and draw them with dotted lines so that we can break the graph along those lines and make sure that the graph doesn't touch them.
- Construct a table of values by taking some random numbers for x (on both sides of the x-intercept and/or on both sides of the vertical asymptote) and calculating the corresponding values for y.
- Plot the points from the table and join them by taking care of asymptotes, domain, and range.
Graphing Rational Functions
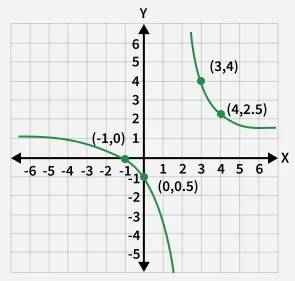
For example, draw a rational function f(x) = \frac{x + 1}{x - 2}. Subsequently, we apply the above procedure to graph the rational function.
- Domain = {x ∈ R | x ≠ 2}; Range = {y ∈ R | y ≠ 1}. If you want to get the domain and range of a rational function,
- Its x-intercept is (-1, 0), and the y-intercept is (0, -0.5).
- There are no holes.
- Vertical asymptote (VA) x = 2, horizontal asymptote (HA) y = 1.
- Choose points on both sides of the vertical asymptote x=2 and find their corresponding y-values.
| X | Y |
|---|---|
| -1 | (-1+1)/(-1-2) = 0 (x-int) |
| 0 | (0+1)/(0-2) = -0.5 (y-int) |
| 2 | VA |
| 3 | (3+1)/(3-2) = 4 |
| 4 | (4+1)/(4-2) = 2.5 |
- Let us plot all these points along with VA and HA
Graphing Exponential Functions
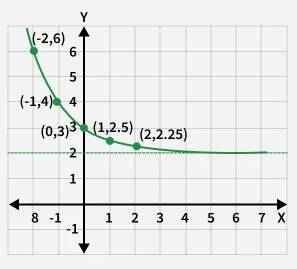
Imagine we have a function f(x) = 2 - x + 2, which has exponential form. Let us graph it using the same steps as before.
- Its domain is all real numbers, and the range is y > 2.
- It has a horizontal asymptote at y = 2.
- It has no x-intercepts, and its y-intercept is (0,3).
- Since we only have one point so far, which is (0, 3), we can take some random numbers on both sides of x = 0 and frame a table.
| X | Y |
|---|---|
| -2 | 2-(-2) + 2 = 6 |
| -1 | 2-(-1) + 2 = 4 |
| 0 | 3 (y-int) |
| 1 | 2-1 + 2 = 2.5 |
| 2 | 2-2 + 2 = 2.25 |
- Let us plot all these points on the graph.
Graphing Logarithmic Functions
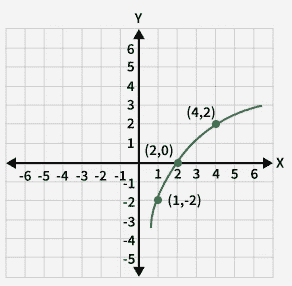
To graph a logarithmic curve, choose the function, for example, f(x) = 2log₂x - 2. We can now draw this graph by following the steps demonstrated before.
- Its domain is x > 0, and its range is the set of all real numbers (R).
- Its x-int is (2, 0), and there is no y-int.
- Its vertical asymptote is x = 0 (y-axis), and there is no horizontal asymptote.
- No holes.
We've only one point so far, which is (2, 0). We'll construct a table by taking many arbitrary values of x > 0 (we cannot choose values of x lower than 0, as the domain is x> 0).
| X | Y |
|---|---|
| 1 | 2 log2 1 - 2 = -2 |
| 2 | 0 (x-int) |
| 4 | 2 log₂ 4 - 2 = 2 |
Note that we've chosen similar figures for x that make it easy to simplify the y-values.
- We will plot the graph now.
Graphing Functions by Transformations
We can graph the functions by applying transformations on the graphs of the parent functions.
- Linear function f(x) = x
- Quadratic function f(x) = x2
- Cubic functions f(x) = x3
- Square root function f(x) = √ √x
- Cube root function f(x) = ∛ x
- Absolute value function f(x) = | x|
- Reciprocal function f(x) = 1/x
- Exponential function f(x) = ax, 0 > a, a ≠ 1
- Logarithmic function f(x) = log x
We need to have an idea about what the graph of each of these parent functions looks like (by clicking on the separate links). also, we can apply the following transformations to graph the given function.
| X | Y |
|---|---|
| f(x) + c | It shifts the graph by c units upward. |
| f(x) - c | It shifts the graph by c units downward. |
| f(x + c) | It shifts the graph c units to the left. |
| f(x - c) | It shifts the graph c units to the right. |
| -f(x) | It reflects the graph on the x-axis (upside down). |
| f(-x) | It reflects the graph in the y-axis (i.e., the top and bottom sides are swapped). |
| f(ax) | Horizontal dilation by a factor of 1/a. |
Solved Examples
**Example 1: Determine which of the following points lie on the graph of function f(x) = 2x3 - 2.
(a) (1, 1)
(b) (1, 0)
(c) (2, 6)
**Solution:
We'll substitute each point in the given function to see which of them satisfies the function.
a)( 1, 1) = ( x, f( x))
1 = 2( 1) 3- 2
1 = 2- 2
1 = 0, not satisfied
So( 1, 1) is NOT on the graph of the function.
b)( 1, 0) = ( x, f( x))
0 = 2( 1) 3- 2
0 = 2- 2
0 = 0, satisfied
So( 1, 0) is on the graph of the function.
c)( 2, 6) = ( x, f( x))
6 = 2( 2) 3- 2
6 = 16- 2
6 = 14, not satisfied
So( 2, 6) is NOT on the graph of the function.
**Answer: Only( b) lies on the given function.
**Example 2: Does the graph given in illustration 1 have any asymptotes? Explain. How many branches does it have?
**Solution:
The given function is f( x) = 2x3- 2, which is a polynomial function and hence it has no asymptotes.
When there are no asymptotes, we will get only one curve( as the curve does not break anywhere) while graphing functions.
**Answer: No asymptotes and only one curve.
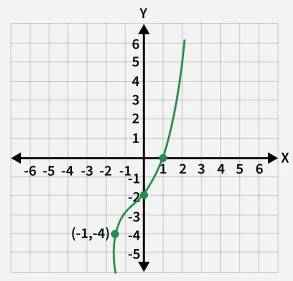
**Example 3: Draw the graph of the function given in Example 1 along with the point(s) you set up from its result.
**Solution:
In illustration 1, we have already found that( 1, 0) lies on the function f( x) = 2x3- 2. For graphing functions, we need further points. Let us construct a table for the same.
X Y -1 2(-1)3 - 2 = -4 0 2(0)3 - 2 = -2 Let us plot these points along with (1, 0) and plot it.
**Answer: The graph is drawn.
Practice Questions
1. Draw the graph of the following functions:
- f(x) = x − 2
- f(x) = 9
- f(x) = √x + 1
2. Graph the cosine function y = cos(x) for 0 ≤ x ≤ 2π
3. Plot the tangent function y = tan(x) over the interval −π/2 ≤ x ≤ π/2